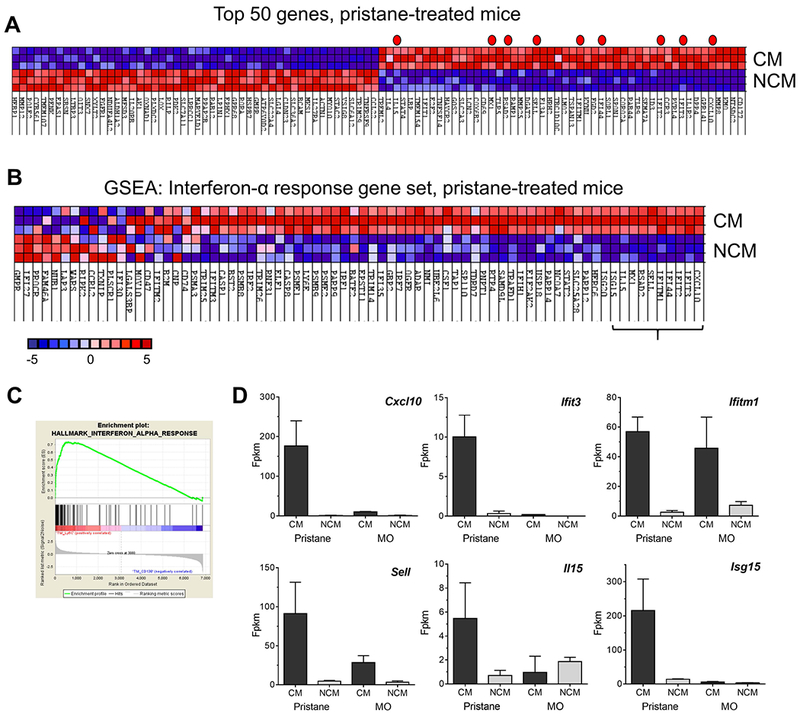
Figure 3. Gene expression in Mϕ subsets from pristane or MO treated mice.

CM and NCM from pristane-treated mice were flow-sorted as in Fig. 1 and analyzed by RNA-Seq. A, heat map of the top 50 features for CM vs. NCM from pristane treated mice. Genes represented in the Hallmark IFNα Gene Set are indicated by a red dot. B, GSEA, hallmark interferon-α response gene pathway, CM vs. NCM from pristane treated mice. Expression levels of the top 10 genes (indicated by bracket) in CM and NCM are shown in Figs. 2B and 3D. C, GSEA enrichment plot, hallmark interferon-α response gene pathway. D, Expression of Cxcl10, Ifit3, Ifitm1, Sell, Il15, and Isg15 in CM vs. NCM from pristane- and MO-treated mice. Fpkm, fragment per kilobase million.
