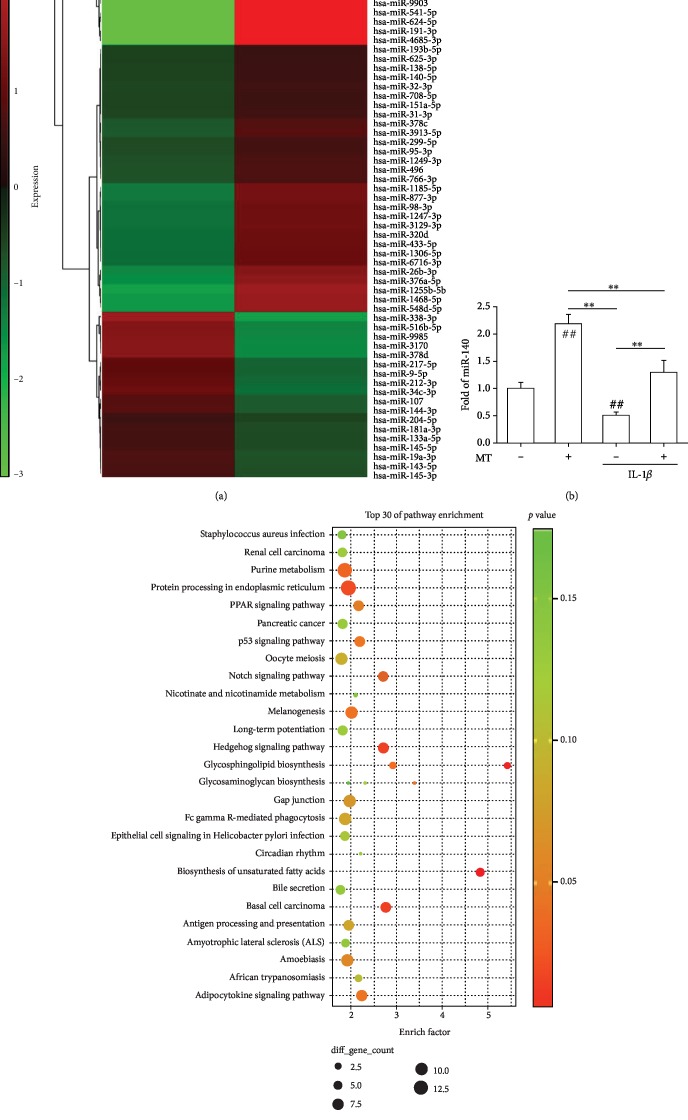
Figure 5.
Identification of miRNAs that are differentially expressed in melatonin-treated human articular chondrocytes. (a) Differentially expressed miRNAs in chondrocytes in response to melatonin were illustrated as a heat map. The color bars on the left of the heat map indicate gene expression level; red denotes high expression and blue denotes low expression, relative to the median. (b) Real-time PCR validation of miR-140 expression in IL-1β-treated and melatonin-treated chondrocytes. Values are the mean ± S.E.M. of four independent experiments (n = 4) in PCR. (c) Pathway enrichment analysis for targets of miRNAs. The size of the dots (gene count) represents the number of genes (predicted targets of differentially expressed miRNAs) involved in a given biological process. The color of the dots represents p value. The terms are sorted alphabetically. Statistically significant differences are indicated by ## where p < 0.01 vs. the CTRL group and ∗∗ where p < 0.01 between the indicated groups.

