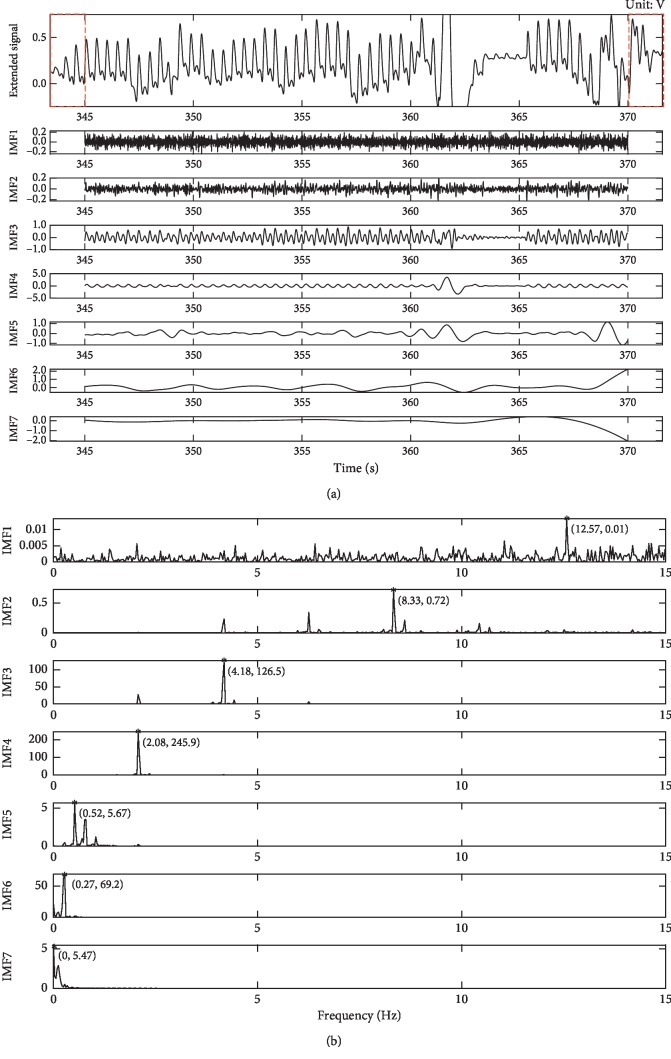
Figure 5.
IMFs and PSD of PPG signal decomposed by SVR-EEMD. (a) Time series of IMFs. The first row is the extended version of the PPG signal shown in Figure 4(a). (b) PSD of each IMF. The corresponding maximum frequency point is marked with a red asterisk and values in parentheses.

