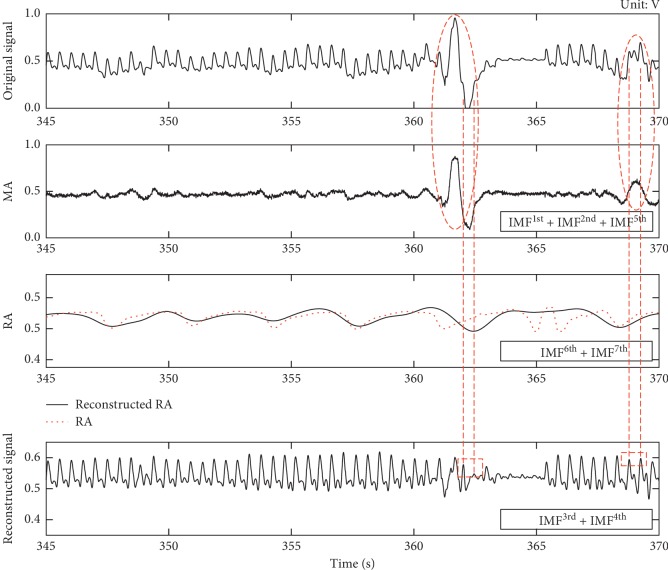
Figure 6.
MA, RA, and PPG signals reconstructed by the SVR-EEMD method. The red elliptical areas are two ripples decomposed from the original signal, and the red dotted curve presents the recorded respiratory activity in the dataset. The two red rectangles indicate the recovered peaks of the reconstructed PPG signal by IMF3rd plus IMF4th.

