
Figure 8. PCB126 induces expression of pparg across multiple sensitive killifish populations but not in resistant populations.
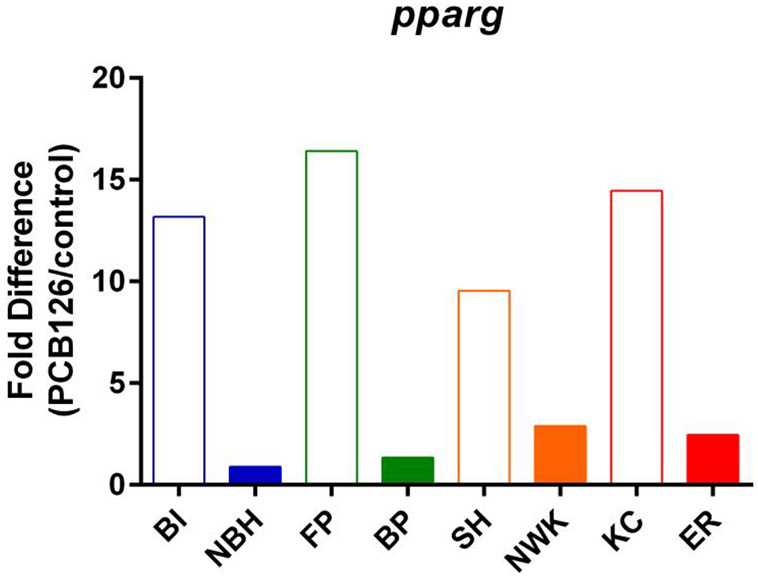
Pparg expression data are from (Reid et al., 2016). Killifish from sensitive and resistant population pairs were treated with DMSO or PCB126 (610 pM) in seawater from 1 dpf to post-organogenesis (stage 35, ~10 dpf). mRNA expression was determined by RNA-Seq. A map of the locations can be found in (Reid et al., 2016). Sensitive populations (open bars): BI = Block Island, RI. FP = Flax Pond, NY. SH = Sandy Hook, NJ. KC = Kings Creek, VA. Resistant populations (closed bars): NBH = New Bedford Harbor, MA. BP = Bridgeport, CT. NWK = Newark, NJ. ER = Elizabeth River, VA. Pparg expression following PCB126 treatment was determined by dividing the average, normalized expression level (N=3-5) in PCB126 treated embryos by that in vehicle treated embryos. Overall, there was 13.4 ± 1.5 fold induction in sensitive populations versus 1.9 ± 0.9 fold induction in resistant populations (p<0.003, Student’s t-test).