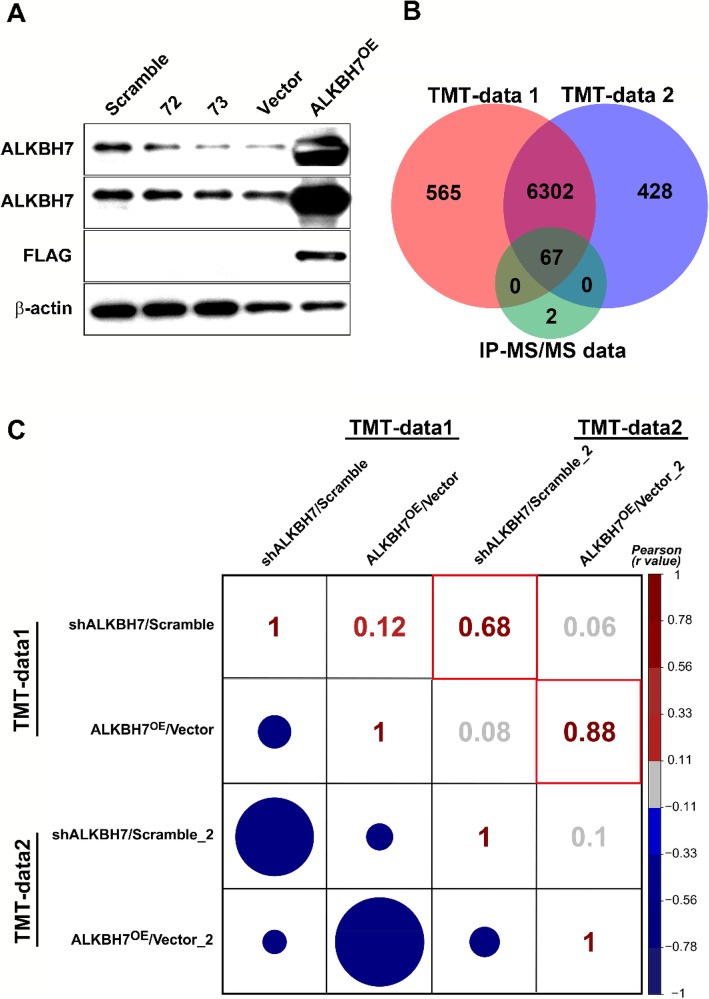
Fig. 2.
Venn diagram and correlation analysis of identified proteins in shALKBH7 and ALKBH7OE cell lines through TMT-based MS/MS. (a) transient overexpressed ALKBH7-FLAG HEK293T cells and the stable ALKBH7 knockdown HeLa cell line ‘72’ and ‘73’. (b) The number of proteins unique to, or shared by, both biological replicates of TMT-based MS/MS and IP-MS/MS is shown in a Venn diagram. (c) Correlation matrix showing all the abundance of the identified proteins in two biological replicates of TMT-based MS/MS. Red boxes indicate correlations between biological duplicates

