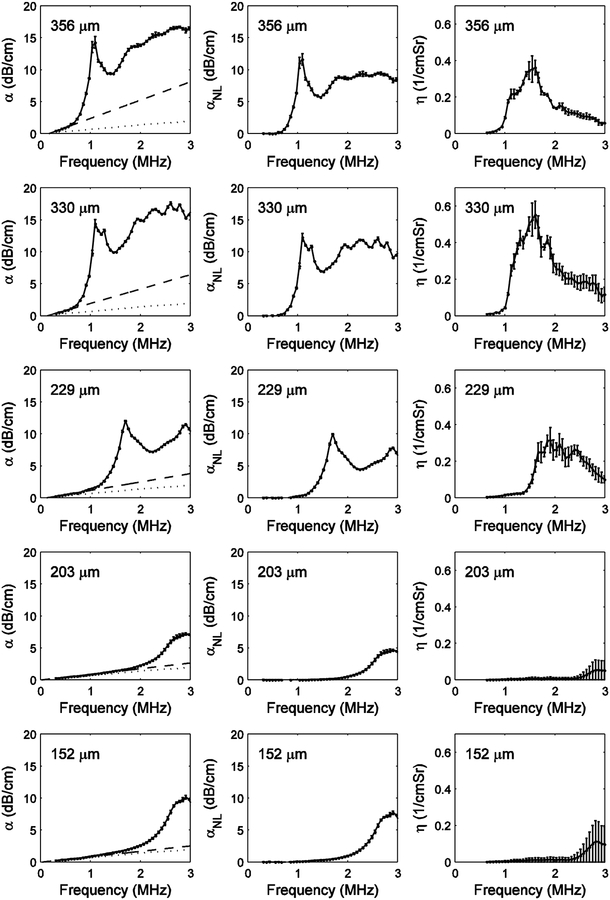
Figure 4.
Results for the 5 phantoms containing 10 mm clear nylon filaments. The left panel shows measurements of attenuation coefficient vs. frequency. The dotted lines correspond to frequency-dependent attenuation coefficients measured from the reference phantom (i.e., phantom without nylon filaments). The dashed lines correspond to linear fits of attenuation coefficient vs. frequency at low frequencies. The middle panel shows the nonlinear component of attenuation coefficient, αNL(f), which is the difference between α(f) (left panel) and the low-frequency linear fit to α(f) (left panel, dashed line). The right panel shows measurements of backscatter coefficient, η(f).

