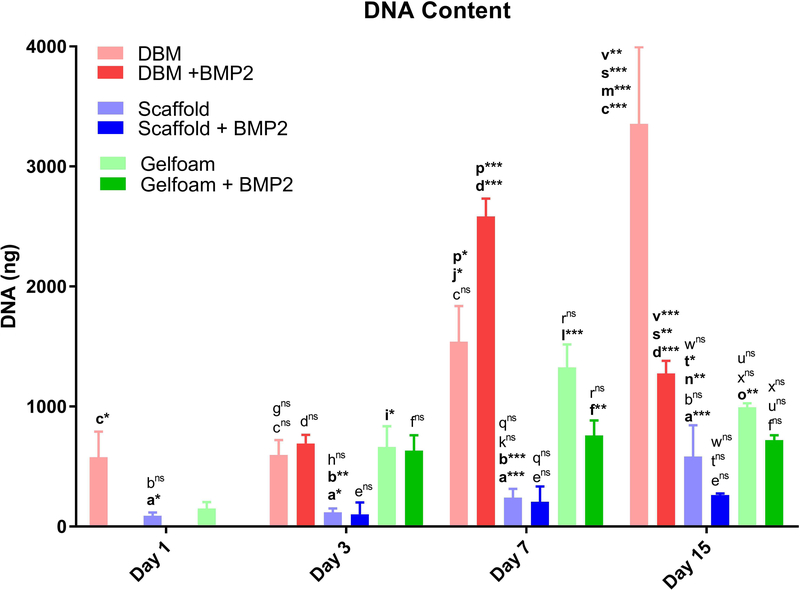
Figure 2. C2C12 cells proliferate slowly on the decellularized bone constructs.
DBM (red bars), bone scaffold (blue bars), or gelfoam (green bars) constructs were treated with control media, osteogenic media (OM), or OM with 100 ng/mL BMP-2 starting on day 2. Constructs were harvested at days 1, 3, 7, and 15, DNA content was measured with the PicoGreen® assay, and represented as mean DNA mass ± SD. * represents p<0.05, ** represents <0.01, and *** represents p<0.001 by two-way ANOVA for construct and treatment and one-way ANOVA for time within each construct and treatment. Comparisons are annotated as below:
(a) scaffold vs DBM; (b) scaffold vs gelfoam; (c) DBM vs gelfoam
(d) DBM OM vs OM + BMP-2; (e) scaffold OM vs OM + BMP-2 (f) gelfoam OM vs OM + BMP-2;
(g) DBM day 1 vs 3; (h) scaffold day 1 vs 3; (i) gelfoam day 1 vs 3;
(j) DBM day 1 vs 7; (k) scaffold day 1 vs 7; (l) gelfoam day 1 vs 7;
(m) DBM day 1 vs 15; (n) scaffold day 1 vs 15; (o) gelfoam day 1 vs 15;
(p) DBM day 3 vs 7; (q) scaffold day 3 vs 7; (r) gelfoam day 3 vs 7
(s) DBM day 3 vs 15; (t) scaffold day 3 vs 15; (u) gelfoam day 3 vs 15
(v) DBM day 7 vs 15; (w) scaffold day 7 vs 15; (x) gelfoam day 7 vs 15

