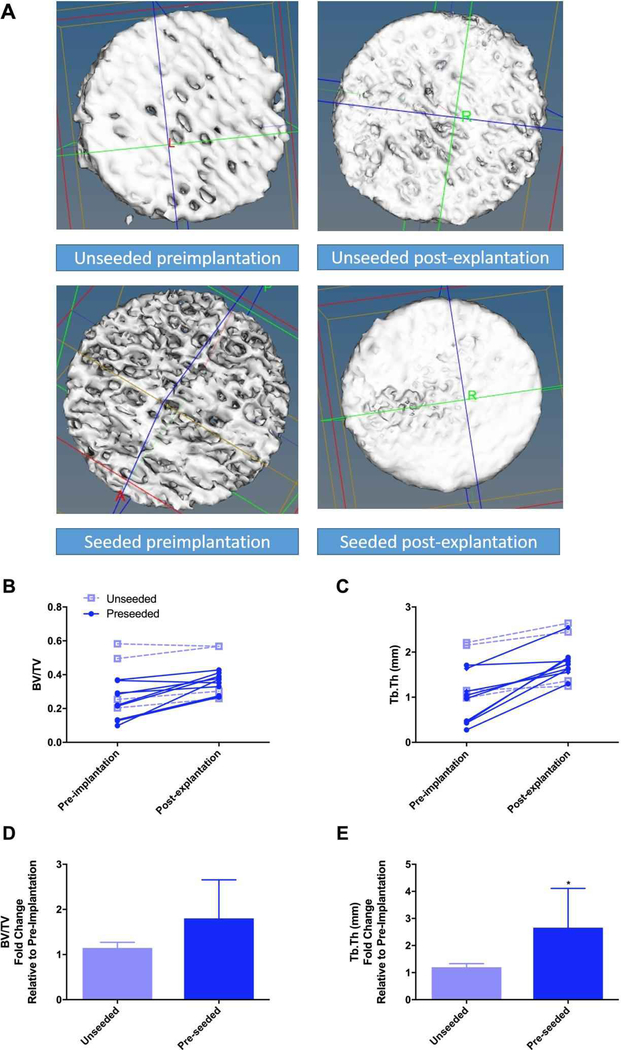
Figure 9. New bone formation occurs in implanted bone constructs.
Bone scaffold structure was analyzed by microCT (pre-implantation) and then implanted subcutaneously in mice either unseeded (open squares) or pre-seeded with MC3T3-E1 pre-osteoblast cells (closed circles). Representative microCT 3D projections of the bone scaffolds prior to implantation (left) and after explantation (right) from unseeded (top row) and seeded (bottom row), grossly demonstrating an appearance of bone formation are shown in A. Implants were removed after four weeks and scanned again by microCT (post-explantation). Bone volume ratio (BV/TV, B) and trabecular thickness (Tb.Th, C) were calculated, and the change between individual scaffolds is shown. Fold change in BV/TV (D) and Tb.Th (E) are shown for unseeded (light blue bars) and preseeded (dark blue bars) as mean ± SD. * represents p<0.05 by paired t-test.

