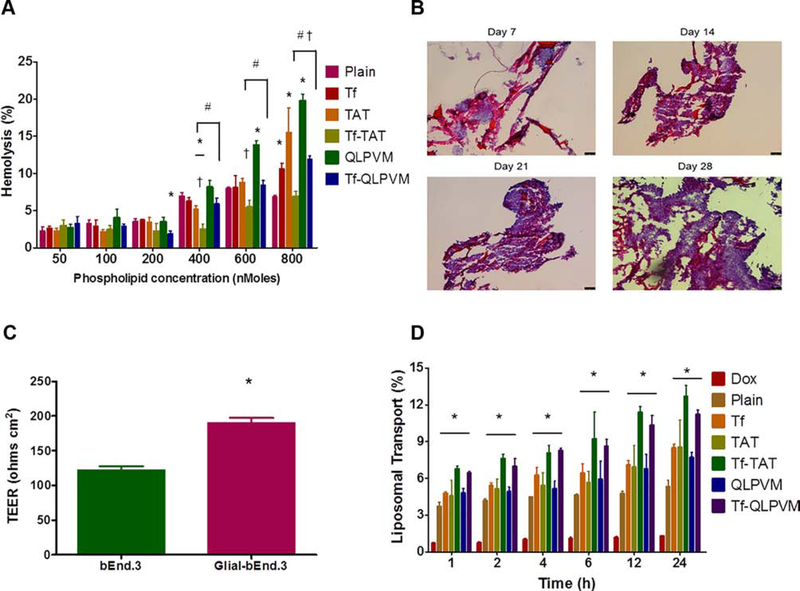
Figure 3.
(A) The graph represnts the percent hemolytic activity of various liposomes on RBCs after 1 h incubation. Significant (p < 0.05) differences are shown as with ( *) plain liposomes, (†) TAT-liposomes, and (#) QLPVM-liposomes. (B) The histological sections of PLGA-chitosan scaffold show tumor cell proliferation at different time points (10X magnification). (C) The graphical plot demonstrates the TEER value for the co-culture (glial and endothelial cells) and endothelial monolayer model only. Statistically significant (p < 0.05) difference is shown as (*) with endothelial monolayer. Data represented as mean ± SD, (n=4). (D) The plot represents the percent transport of various liposomes loaded with doxorubicin across in vitro brain tumor model, over a period of 24 h. Statistically significant (p < 0.05) higher are demonstrated in comparison to to (*) free drug. Data represented as mean ± SD, (n=3).

