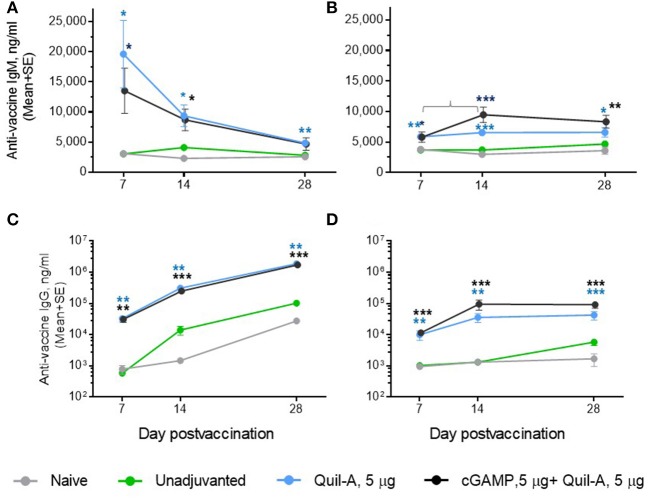
Figure 4.
Comparison of the time course of antibody response between ID-vaccinated adult (A,C) and aged (B,D) mice. (A,B) vaccine-specific IgM; (C,D) vaccine-specific IgG. Note that in (A,B), the Y scale is linear and in (C,D) it is logarithmic. Groups: gray—naïve (n = 5 in aged, 9 in adults); green—vaccine only (n = 9 in aged, 5 in adults); blue—vaccine + 5 μg Quil-A (n = 4 in aged, 5 in adults); black—vaccine + 5 μg Quil-A + 5 μg cGAMP (n = 5 in aged and in adults). The bracket in B denotes a 1.6—fold increase (p = 0.04) in vaccine-specific IgM level between days 7 and 14. Stars indicate significance levels of the differences between adjuvanted and non-adjuvanted group at the same time postvaccination calculated as described in Figure 1.

