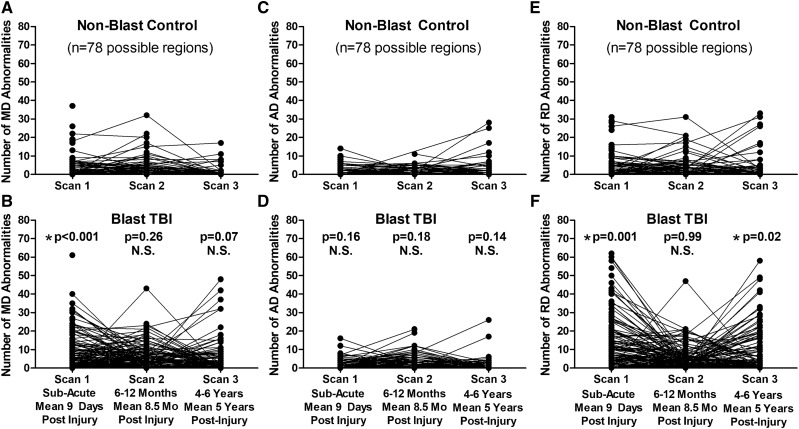
Figure 3.
Longitudinal MD, AD and RD abnormalities in concussive blast TBI compared with non-blast control. (A and B) Comparison of the number of abnormal MD regions by time point identified a significant difference at the sub-acute, but not 1-year or 5-year, follow-up evaluations. (C and D) In contrast, there were no significant differences in the number of abnormal AD regions at any time point comparing the two groups. (E and F) Evaluation of abnormal RD regions over time revealed significant differences at the sub-acute and 5-year, but not 1-year, evaluations for blast TBI compared with non-blast controls parallel to the pattern observed with FA. P-values reported are adjusted for age, education, gender and scanner at each time point. Subsequent head injury exposure was also collected at the 5-year evaluation and included with the other covariates for Scan 3 statistical adjustment to determine significance. Asterisk indicates P-values that remained significant after Benjamini–Hochberg correction for multiple comparisons.

