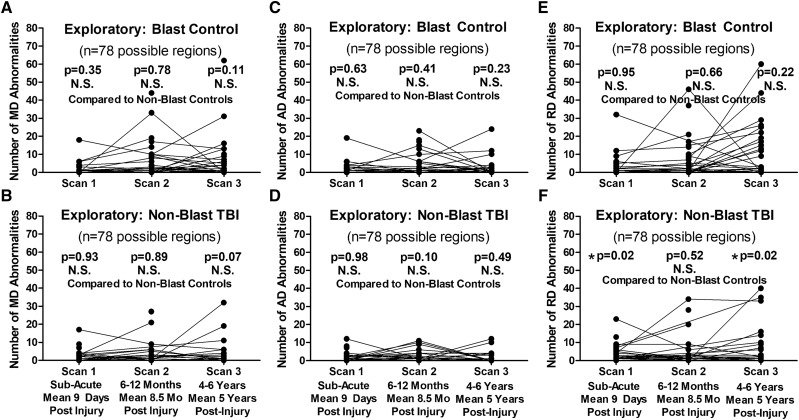
Figure 5.
Exploratory evaluation of longitudinal MD, AD and RD abnormalities in blast-exposed controls and concussive non-blast TBI compared with non-blast controls. Comparison of the number of abnormal MD regions by time point did not identify any significant differences for blast-exposed controls (A) or non-blast TBI (B) compared with non-blast controls. There were also no significant differences in the number of abnormal AD regions at any time point for either the blast-exposed controls (C) or non-blast TBI (D) compared with non-blast controls. For the number of abnormal RD regions, there were no differences for blast-exposed control (E), while there were significant differences at the sub-acute and 5-year time points but not 1-year time point for non-blast TBI (F) compared with non-blast controls. P-values reported are adjusted for age, education, gender and scanner at each time point. Subsequent head injury exposure was also collected at the 5-year evaluation and included with the other covariates for Scan 3 statistical adjustment to determine significance. Asterisk indicates P-values that remained significant after Benjamini–Hochberg correction for multiple comparisons.

