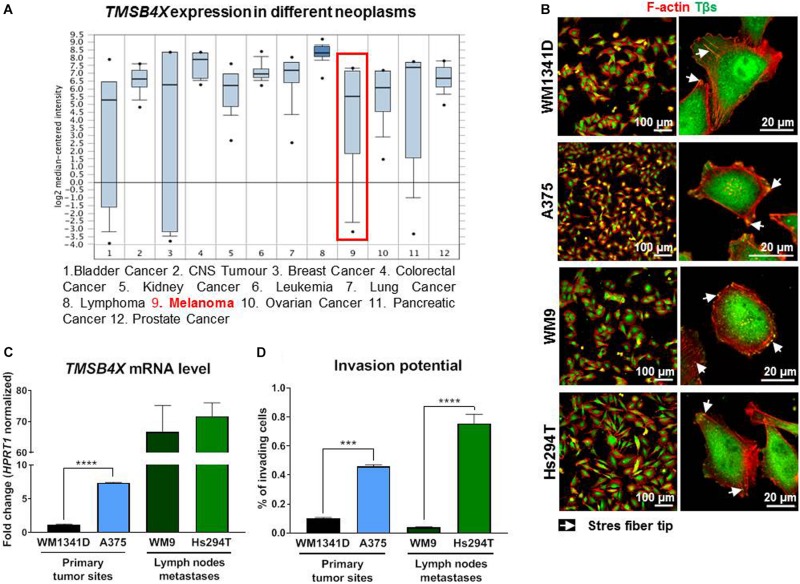
FIGURE 1.
Evaluation of TMSB4X expression in different neoplasms and human melanoma cell lines differing in invasion abilities. (A) TMSB4X expression depending on neoplasia type; adapted from oncomine.org; (B) Immunostainings of four human melanoma cell lines to visualize F-actin and Tβs. Left column shows lower magnification, whereas the right one present microphotographs of single cells. (C) qRT-PCR analysis of TMSB4X expression in cell lines obtained from primary tumor sites and metastases (n = 3). (D) 3D-migration/invasion analysis of four melanoma cell lines (n = 3). Arrows point at stress fibers tips. The significance level was set at ∗P < 0.05, ∗∗P < 0.01, ∗∗∗P < 0.001, and ∗∗∗∗P < 0.0001 (www.oncomine.org, February 2018, Thermo Fisher Scientific, Ann Arbor, MI, United States).

