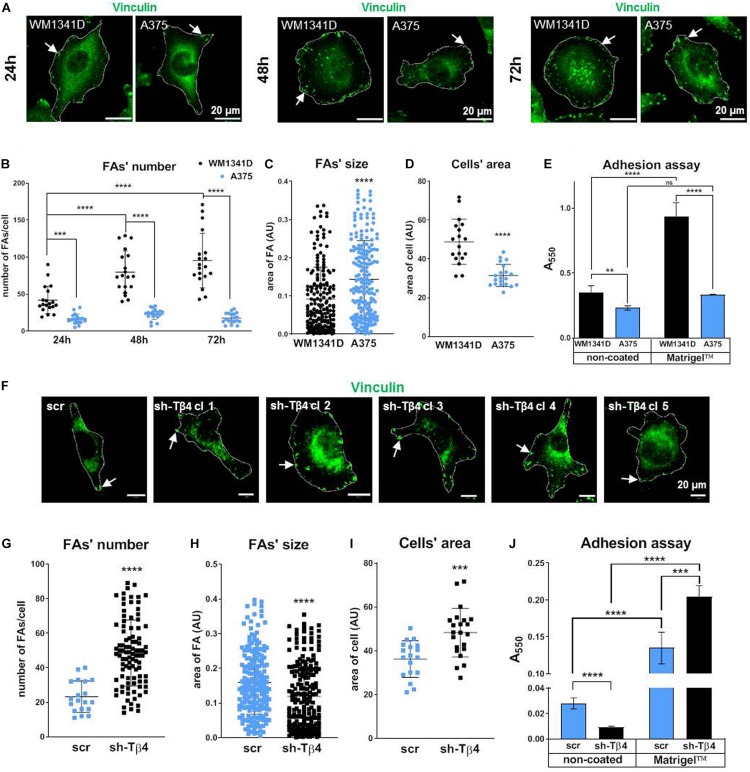
FIGURE 3.
Focal adhesion formation in WM1341D and A375 cells and effect of TMSB4X expression silencing on formation of FAs in melanoma cells. (A,F) Immunocytochemical analysis of cells in order to visualize vinculin. Cells’ borders were marked for better orientation with white lines. Quantitation of FAs’ number (B,G), size of FA’s (C,H), and cell’s area (D,I) (n = 20). (E,J) Adhesion assays of investigated cell lines and clones (n = 3). Arrows point at FAs. The significance level was set at ∗P < 0.05, ∗∗P < 0.01, ∗∗∗P < 0.001, and ∗∗∗∗P < 0.0001 (www.oncomine.org, February 2018, Thermo Fisher Scientific, Ann Arbor, MI, United States).

