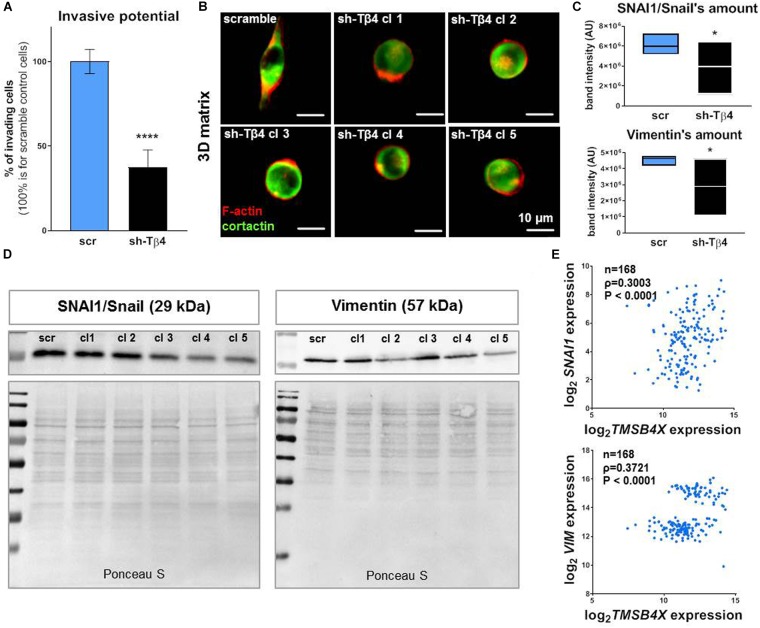
FIGURE 7.
Silencing of TMSB4X expression has an impact on EMT in A375 cells. (A) Invasive potential of A375-shTMSB4X clones compared to A375-shscr (n = 3). (B) Immunocytochemical analysis of A375-shscr and A375-shTMSB4X clones embedded in MatrigelTM gel. Fluorescently labeled phalloidin and antibodies were used to visualize F-actin and cortactin. (C,D) Western blot analysis of SNAI1/Snail and vimentin levels in A375-shscr and A375-shTMSB4X clones: (C) densitometry (n = 3) and (D) representative immunoblots. 30 μg of protein was loaded on every lane. Membranes prior to incubation with antibodies were stained with Ponceau S to show equal protein loading on lanes. (E) Microarray analysis of TMSB4X and SNAI1 or VIM expression’s correlation in patients samples (n = 168). The significance level was set at ∗P < 0.05, ∗∗P < 0.01, ∗∗∗P < 0.001, and ∗∗∗∗P < 0.0001 (www.oncomine.org, February 2018, Thermo Fisher Scientific, Ann Arbor, MI, United States).

