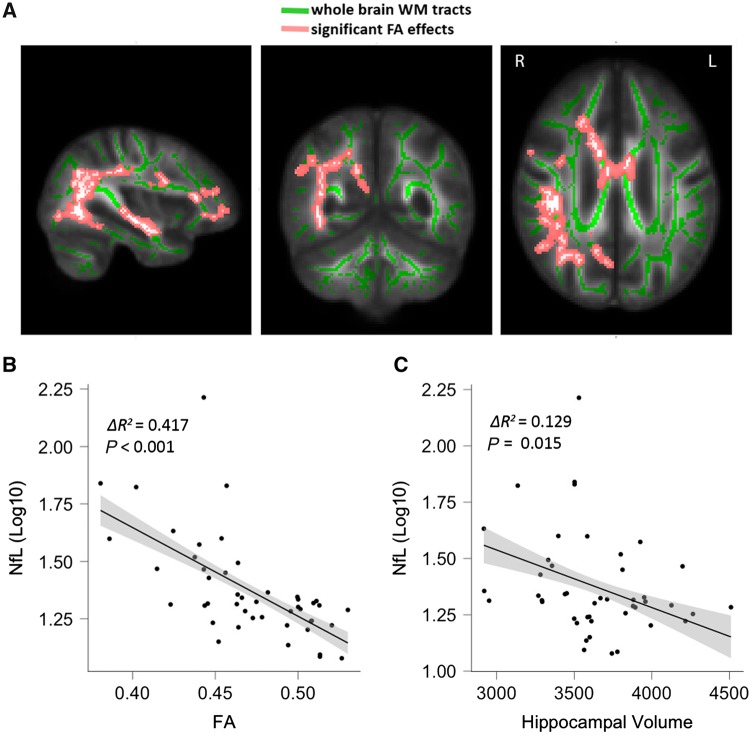
Figure 1.
Associations of NfL with imaging markers of neurodegeneration. (A) T-map showing the anatomical location of changes in fractional anisotropy (FA) that correlate with NfL. (B) Raw data for correlation of fractional anisotropy and NfL. Fractional anisotropy values were averaged over all significant voxels. (C) Association of hippocampal volume and NfL. WM = white matter.

