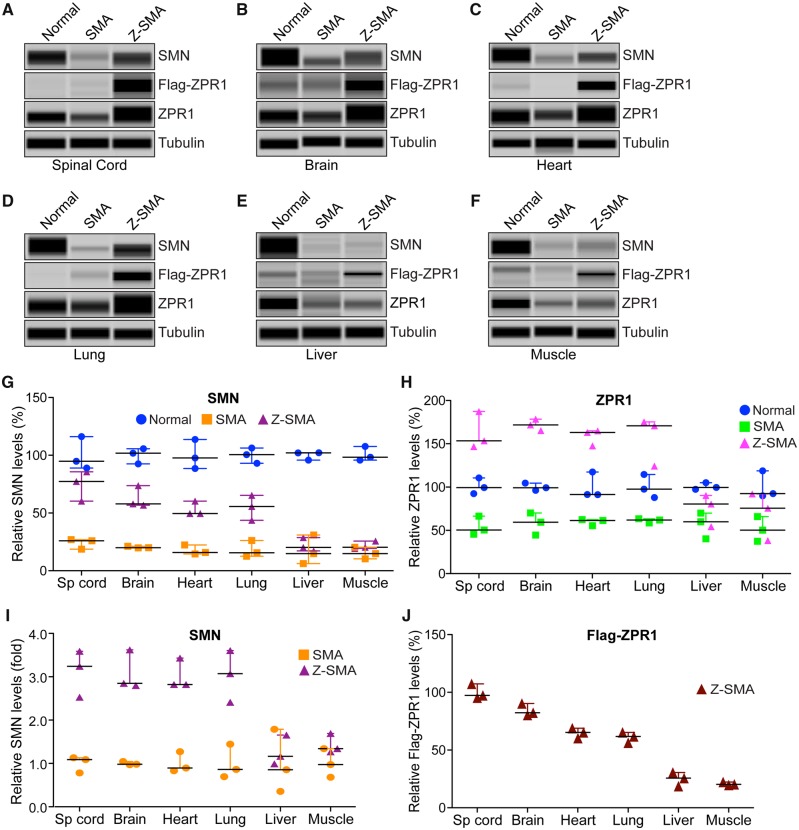
Figure 4.
ZPR1 overexpression increases SMN levels in neuronal and non-neuronal tissues and leads to SMN-dependent amelioration of SMA phenotype. Proteins levels of SMN, ZPR1, Flag-ZPR1 and tubulin were examined by immunoblot analysis of mouse tissues. (A) spinal cord, (B) brain, (C) heart, (D) lung, (E) liver and (F) muscle from 7-day-old normal, SMA and Z-SMA mice using automated capillary Wes™ System (ProteinSimple) and quantification was performed using Compass software. Representative capillary-blot images of proteins are shown (full-length blots are provided in Supplementary Figs 2 and 3). Quantitative data are shown as a scatter plot with median, min and max; (median, min, max) range shows relative increase in SMN levels (%) in different tissues by ZPR1 overexpression in the: (G) spinal cord [SMA (25.96, 18.65, 26.98) and Z-SMA (77.32, 60.32, 85.63)], brain [SMA (19.96, 19.79, 21.24) and Z-SMA (57.93, 56.87, 73.67)], heart [SMA (15.76, 14.62, 22.36) and Z-SMA (49.61, 49.60, 60.32)], lung [SMA (15.61, 12.58, 26.19) and Z-SMA (55.69, 43.72, 65.36)], liver [SMA (14.82, 6.13, 30.98) and Z-SMA (20.20, 17.18, 28.65)] and muscle [SMA (14.78, 10.32, 20.36) and Z-SMA (20.36, 19.32, 25.63)] and statistical analysis (unpaired t-test) of protein levels (mean ± SEM, n = 3 mice/group) shows that ZPR1 overexpression resulted in statistically significant increase of SMN levels in the spinal cord of Z-SMA (74.42 ± 7.44, P = 0.0031) compared to SMA (23.86 ± 2.62), brain of Z-SMA (62.82 ± 5.43, P = 0.0015) compared to SMA (20.33 ± 0.45), heart of Z-SMA (53.18 ± 3.57, P = 0.0012) compared to SMA (17.58 ± 2.41), lung of Z-SMA (54.92 ± 6.25, P = 0.0080) compared to SMA (18.13 ± 4.12) but not in the liver of Z-SMA (22.01 ± 3.43, P = 0.5907) compared to SMA (17.31 ± 7.27) and muscle of Z-SMA (21.77 ± 1.95, P = 0.1317) compared to SMA (15.15 ± 2.90) relative to respective normal mice tissues protein levels (100%) normalized to tubulin. (H) Quantitative analysis of increase in relative levels (%) of total ZPR1 expression in the: spinal cord [SMA (50.36, 45.63, 66.36) and Z-SMA (153.47, 146.73, 187.32)], brain [SMA (59.34, 44.50, 70.12) and Z-SMA (171.80, 165.32, 178.36)], heart [SMA (61.36, 55.48, 62.36) and Z-SMA (163.06, 147.51, 164.91)], lung [SMA (61.89, 58.50, 63.35) and Z-SMA (170.76, 124.33, 175.32)], liver [SMA (59.99, 40.32, 69.97) and Z-SMA (80.36, 54.32, 90.32)] and muscle [SMA (50.32, 37.39, 65.95) and Z-SMA (75.66, 38.25, 92.04)]. Statistical analysis of increase in levels of total ZPR1 protein using antibody against ZPR1 shows increase in ZPR1 levels in the spinal cord of Z-SMA (162.50 ± 12.56, P = 0.0015) compared to SMA (54.12 ± 6.27), brain of Z-SMA (171.80 ± 3.76, P = 0.0002) compared to SMA (57.99 ± 7.42), heart of Z-SMA (158.50 ± 5.51, P = 0.0001) compared to SMA (59.73 ± 2.14), lung of Z-SMA (156.80 ± 16.29, P = 0.0043) compared to SMA (61.25 ± 1.43), liver of Z-SMA (75.00 ± 10.73, P = 0.2574) compared to SMA (56.76 ± 8.71) and muscle of Z-SMA (68.65 ± 15.92, P = 0.3861) compared to SMA (51.22 ± 8.25) relative to respective normal mouse tissue protein levels (100%) normalized to tubulin. (I) Quantitative data are presented as a scatter plot with median, min and max range shows relative increase in SMN levels in different tissues as fold change in Z-SMA mice compared to SMA mice; spinal cord (3.11 ± 0.31, P = 0.0031), brain (3.08 ± 0.26, P = 0.0015), heart (3.02 ± 0.20, P = 0.0012), lung (3.029 ± 0.34, P = 0.0080), liver (1.27 ± 0.19, P = 0.5911) and muscle (1.43 ± 0.13, P = 0.1333) relative to respective SMA mice tissues protein levels (100% or 1.0-fold) normalized to tubulin. (J) Quantitative data are shown as a scatter plot with median, min and max range shows relative expression (%) of recombinant Flag-ZPR1 in Z-SMA mice; spinal cord (100.027 ± 3.71), brain (84.36 ± 3.05), heart (64.86 ± 2.50), lung (61.17 ± 2.62), liver (24.98 ± 3.47) and muscle (20.78 ± 0.80) relative to Z-SMA spinal cord Flag-ZPR1 levels (100%) normalized to tubulin.

