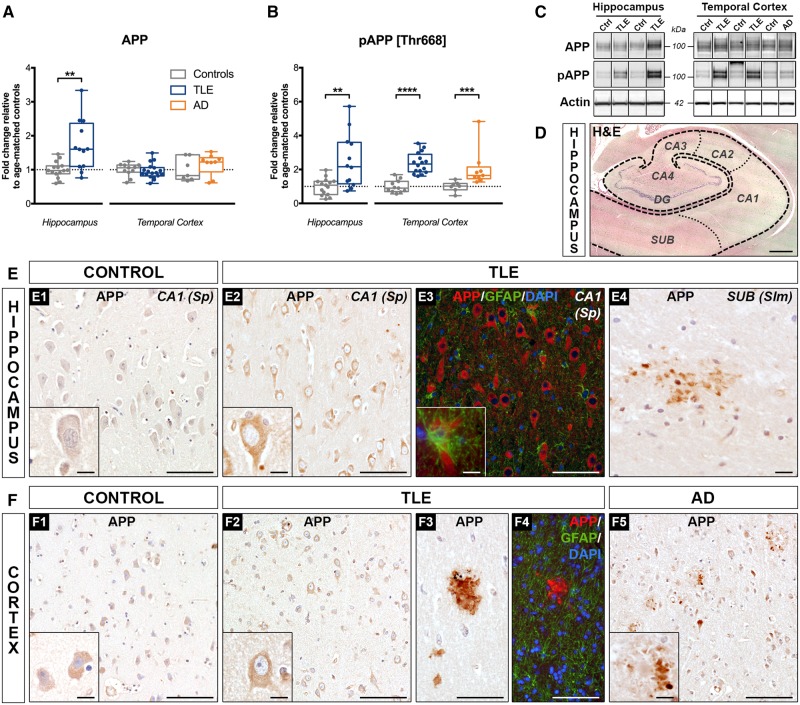
Figure 2.
Increased expression and phosphorylation of APP in human drug-resistant TLE. (A and B) Western blot quantification of (A) total APP and (B) phospho-APP [Thr668] in the hippocampus and temporal cortex from TLE, Alzheimer's disease and control patients. Data are represented as box-and-whisker plots showing the minimum value, the first quartile, the median, the third quartile, and the maximum value. Each group is compared to its respective age-matched control group using two-tailed Student t-test (normal distribution) or Mann-Whitney test (skewed distribution). *P < 0.05, **P < 0.01, ****P < 0.0001. Detailed statistical data are provided in Supplementary Table 4. (C) Representative western blot images showing non-adjacent bands originating from the same blot. (D) Representative hippocampal section from a 37-year-old control subject (Ctrl 11) stained with haematoxylin and eosin (H&E) indicating the subfields imaged for staining illustrations: subiculum (SUB), Cornu Ammonis (CA1 to CA4), and dentate gyrus (DG) with its discernible granule cell layer. (E) Photomicrographs showing the hippocampal CA1 pyramidal cell layer from (E1) a 37-year-old control subject (Ctrl 11); (E2) a 29-year-old TLE patient with hippocampal sclerosis type III (TLE 12), (E3) the CA1 pyramidal cell layer, and (E4) the molecular layer of the SUB region from a 20-year-old TLE patient with hippocampal sclerosis type I (TLE 6); each immunolabelled with APP antibody (clone 22C11) or co-immunolabelled with APP (red), astrocytic marker GFAP (green), and nuclear stain DAPI (blue). Images show enhanced intra-neuronal APP labelling in the TLE hippocampus (E2) relative to control (E1), no detectable APP expression in the astrocytes (E3), and the presence of occasional extracellular APP depositions suggestive of diffuse amyloid plaques (E4). Note the similarities between the diaminobenzidine (E2) and the immunofluorescence (E3) APP signal. (F) Representative images of the temporal cortex from (F1) a 55-year-old control subject (Ctrl 15), (F2) a 29-year-old, (F3) a 24-year-old, and (F4) a 38-year-old TLE patient (TLE 12, TLE 7 and TLE 14, respectively), alongside with temporal cortex images from (F5) a 65-year-old Alzheimer's disease patient (AD 8); each labelled with APP (22C11) or co-immunolabelled with APP (red), GFAP (green), and DAPI (blue). Images demonstrate no apparent differences in neuronal APP expression between TLE (F2) and control cortex (F1), despite the presence of occasional amyloid plaque-like extracellular deposits (F3 and F4), similar to what is observed in the Alzheimer's disease case (F5). Diaminobenzidine (F3) and immunofluorescence (F4) APP labelling showing comparable signal patterns and the lack of APP co-localization with GFAP in the TLE cases (F4). Scale bars = 1000 μm in D, 100 μm in E1–3, F1–5; 10 μm in E4; insets = 10 μm.

