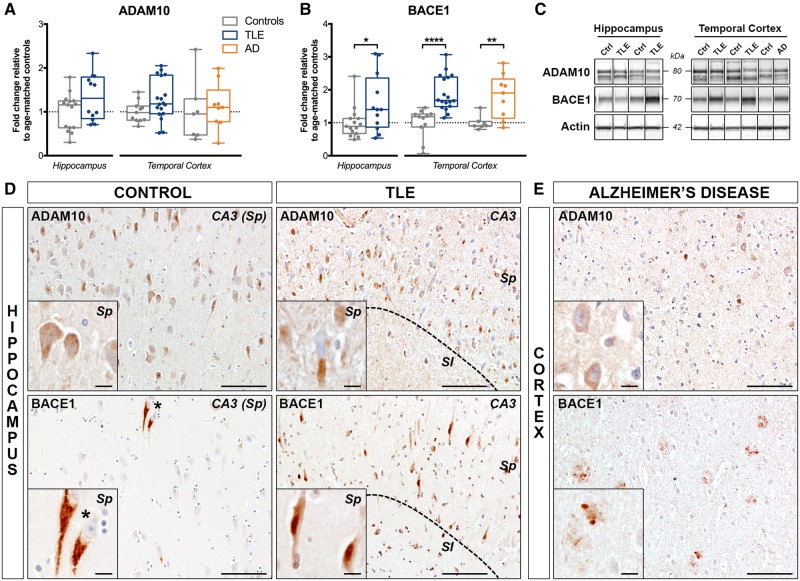
Figure 4.
Differential expression of APP processing enzymes ADAM10 and BACE1 in human drug-resistant TLE. (A and B) Western blot quantification of (A) ADAM10 and (B) BACE1 in the hippocampus and temporal cortex of TLE, Alzheimer’s disease (AD) and control patients. (C) Representative western blot images of non-adjacent bands from the same hippocampus or cortex blot. Box-and-whisker plots display the minimum value, the first quartile, the median, the third quartile, and the maximum value. Each group is compared to its respective age-matched control group using two-tailed Student t-test (normal distribution) or Mann-Whitney test (skewed distribution). *P < 0.05, **P < 0.01, ****P < 0.0001. Detailed statistical data are provided in the Supplementary Table 4. (D) Representative images of the hippocampal CA3 pyramidal cell layer from a 55-year-old control subject (Ctrl 15) and a 38-year-old TLE patient with no hippocampal sclerosis (TLE 14) immunohistochemically labelled with ADAM10 (top row) showing comparable expression patterns in pyramidal neuron cell bodies of control and TLE cases. Photomicrographs of the hippocampal CA3 pyramidal cell layer from the same control subject (Ctrl 15) and of a 55-year-old TLE patient with hippocampal sclerosis type II (TLE 18) immunohistochemically labelled with BACE1 (bottom row) demonstrating increased BACE1 labelling in pyramidal cell bodies and processes in the TLE case relative to control, and occasional BACE1 accumulation in granular-like structures surrounding the nucleus. (E) Temporal lobe cortex from a 72-year-old Alzheimer’s disease patient immunolabelled with ADAM10 (top) and BACE1 (bottom) showing faint ADAM10 labelling in neuronal cell bodies and accumulation of BACE1 mostly in fibrillar amyloid plaques. Scale bars = 100 μm in D and E; insets = 10 μm. Insets show higher magnification images of the same areas. Sl = stratum lucidum; Sp = stratum pyramidale.

