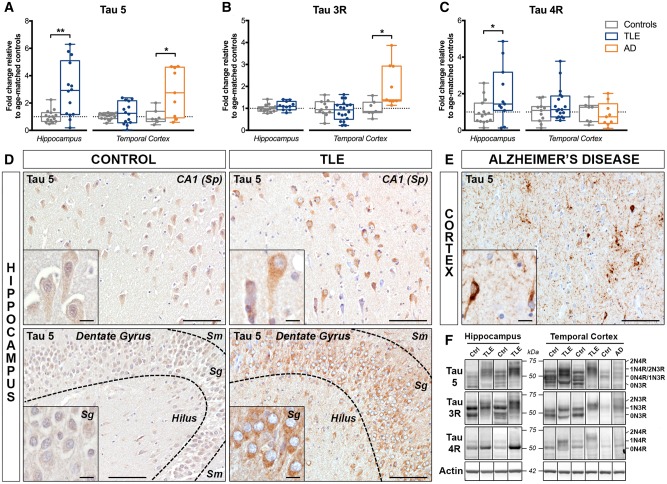
Figure 5.
Increased expression of total tau protein in human drug-resistant TLE. (A–C) Western blot quantification of (A) total tau (antibody clone Tau 5), (B) tau 3-repeat (Tau 3R), and (C) tau 4-repeat (Tau 4R) isoforms in the hippocampus and temporal cortex of TLE, Alzheimer’s disease (AD) and control patients. Box-and-whisker plots display the minimum value, the first quartile, the median, the third quartile, and the maximum value. Each group is compared to its respective age-matched control group using two-tailed Student t-test (normal distribution) or Mann-Whitney test (skewed distribution). *P < 0.05, **P < 0.01. Detailed statistical data are provided in Supplementary Table 4. (D) Representative images of the hippocampal CA1 pyramidal cell layer (top row) from a 55-year-old control subject (Ctrl 15) and a 20-year-old TLE patient with hippocampal sclerosis type I (TLE 6) and of the dentate gyrus (bottom row) from a 37-year-old control subject (Ctrl 11) and a 49-year-old TLE patient with hippocampal sclerosis type II (TLE 17), each immunohistochemically labelled with Tau 5 antibody. Images show stronger labelling of neuronal cell bodies and processes in TLE cases compared to controls within both hippocampal regions. (E) Temporal lobe cortex from a 65-year-old Alzheimer’s disease patient (AD 2) showing typical tau accumulation in neurofibrillary tangles and neuropil threads surrounding amyloid plaques. Scale bars = 100 μm in D and E; insets = 10 μm. Insets show higher magnification images of the same areas. (F) Representative western blot images for the box-and-whisker plot graphs shown in A–C representing non-adjacent bands from the same hippocampus or cortex blot. Images show up to four bands, corresponding to tau isoforms 0N3R (55 kDa), 0N4R or 1N3R (64 kDa), 1N4R or 2N3R (69 kDa), and 2N4R (74 kDa). Sg = stratum granulare; Sm = stratum moleculare; Sp = stratum pyramidale.

