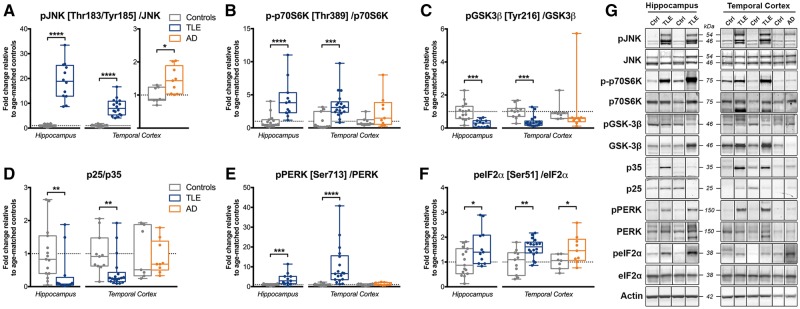
Figure 7.
Dysregulation of JNK, p70S6K, GSK-3β, p25/p35 and PERK/eIF2α signalling in human drug-resistant TLE. (A–F) Western blot quantification of (A) phospho-JNK [Thr183/Tyr185]/JNK, (B) phospho-p70S6K [Thr389]/p70S6K, (C) phospho-GSK-3β [Tyr216]/GSK-3β, (D) p25/p35, (E) phospho-PERK [Ser713]/PERK, and (F) phospho-eIF2α [Ser51]/eIF2α ratios in the hippocampus and temporal cortex of TLE, Alzheimer’s disease (AD) and control (Ctrl) patients. Box-and-whisker plots display the minimum value, the first quartile, the median, the third quartile, and the maximum value. Each group is compared to its respective age-matched control group using two-tailed Student t test (normal distribution) or Mann-Whitney test (skewed distribution). *P < 0.05, **P < 0.01, ***P < 0.001, ****P < 0.0001. Detailed statistical data are provided in the Supplementary Table 4. (G) Representative western blot images of individual proteins depicting non-adjacent bands originating from the same blot.

