FIG 4.
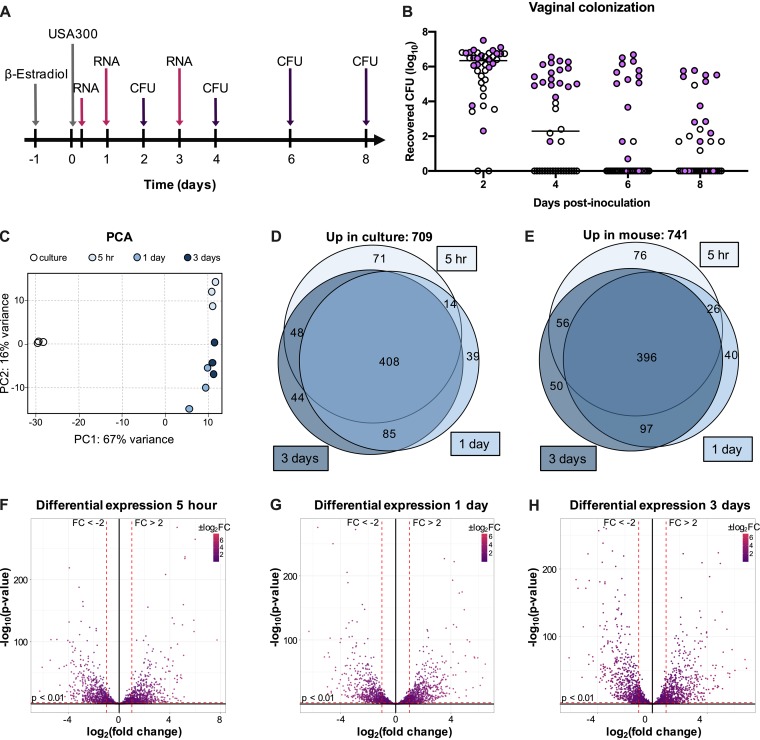
Transcriptome analysis during MRSA vaginal colonization. (A) Experimental design for RNA sequencing analysis of mouse vaginal swabs. (B) CFU counts from mouse vaginal swabs. Samples chosen for RNA sequencing are highlighted in purple. (C) PCA plot for triplicate samples of culture and 5 h, 1 day, and 3 day swabs. (D and E) Venn diagrams showing genes expressed at significantly higher levels (fold change, >2; P < 0.01) in culture (D) or in mouse swab samples (E). (F to H) Volcano plots highlighting genes that are differentially expressed in swab samples from 5 h (F), 1 day (G), and 3 days (H) postinoculation compared to culture.

