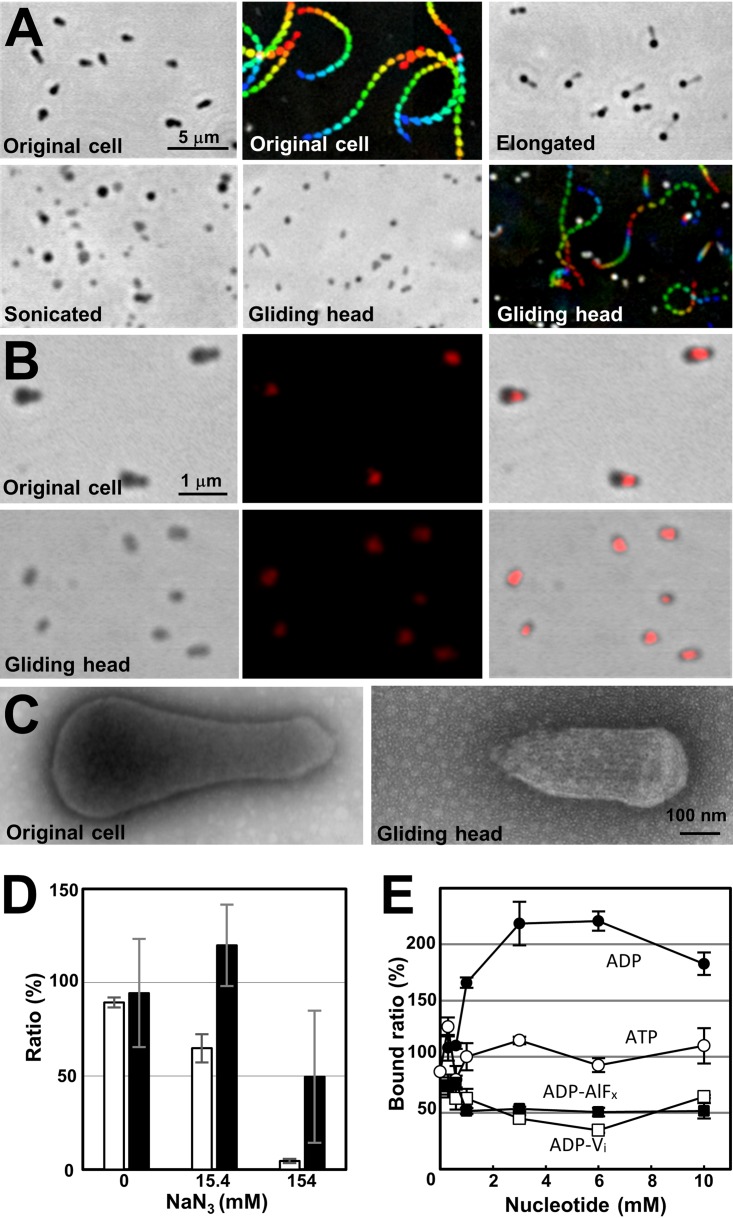
FIG 4.
Isolation and SO binding of the gliding heads. (A) Isolation and reactivation of the gliding heads traced by phase-contrast microscopy. The original cells were elongated and sonicated, and the gliding heads were isolated. The heads were reactivated for gliding by the addition of 2 mM ATP. This gliding movie is available as Movie S6. Gliding motility is presented as an integrated movie image, where movie frames at intervals of 0.5 s are colored from purple to red, and integrated for 10 s. (B) Localization of gliding proteins examined by immunofluorescence microscopy. The images of an original cell and gliding head are presented in the upper and lower panels, respectively. Fluorescent signals labeled for Gli349 (middle) were overlaid on the phase-contrast images (left), and presented as merged images (right). (C) Negatively stained EM images of the original cell and gliding head. (D) Inhibition of binding and gliding speed of gliding heads by sodium azide. The numbers of bound gliding heads at 50 s after addition of sodium azide were counted for three independent fields including 60 to 119 gliding heads and presented as ratios to the numbers before the addition with SDs (white bars). The gliding speeds were measured for 11 gliding heads and presented as ratios to those before the addition with SDs (black bars). (E) Binding of the gliding heads to a glass surface coated by SOs under various concentrations of ATP analogs. The ATP analogs examined are presented near the data points.

