
Figure 5.
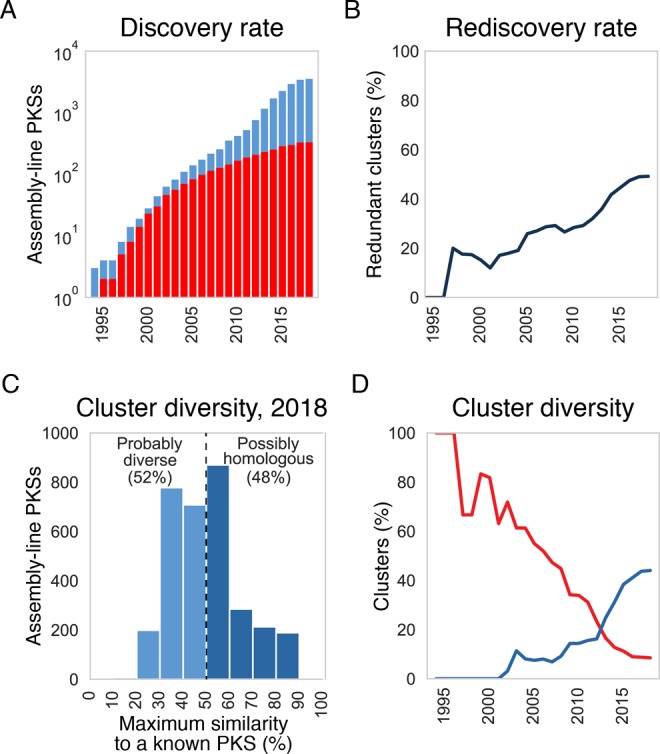
(A) The discovery rate of distinct clusters is shown (blue; having less than 90% amino acid sequence similarity score to any other cluster). Also shown (in red) is the number of clusters with known products, determined using MIBiG database and NCBI annotations. For years 1994–2017, numbers reflect sequences deposited by December of that year. For 2018, only sequences deposited by May were taken into account. (B) Rediscovery rate among nucleotide sequences deposited to NCBI, determined as the percentage of redundant clusters (having more than 90% amino acid sequence similarity score to a previously sequenced cluster). (C) Distribution of sequence similarity scores between an orphan assembly-line PKS and its closest neighbor whose product has been characterized. PKSs with pairwise similarity scores above 50% probably make structurally similar polyketides, while orphan PKSs whose sequences show greater differences from those of any known PKS most likely produce novel chemotypes. (D) The red line plots the percentage of all distinct assembly-line PKSs that are chemically decoded. The blue line plots the percentage of orphan PKSs that are more than 50% similar to a chemically decoded assembly-line PKS.