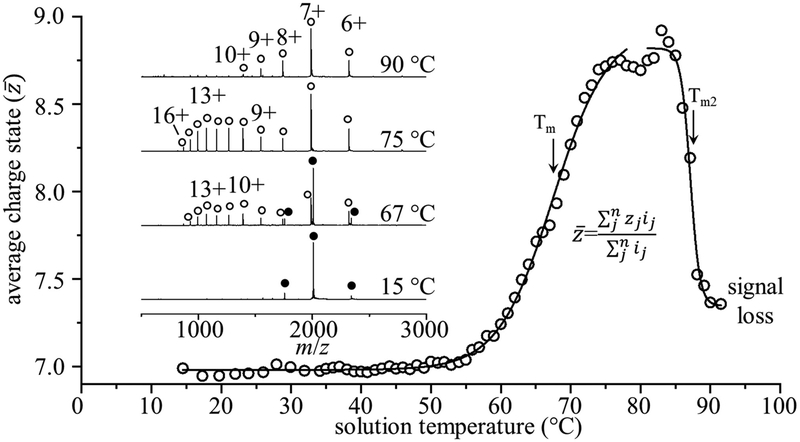
Figure 2.
Weighted average charge state as a function of solution temperature with midpoint melting temperature Tm = 67.5 ± 2.2 °C, and a second transition at Tm2 = 87.1 ± 3.0 °C. Inset mass spectra show shifts in charge state, and dissociation of the cofactor from the holoprotein to form the apo state with increasing temperature. Filled circles represent the holoprotein, and open circles denote the apoprotein. A table of all observed m/z values is provided in the Supporting Information (Table S1).

