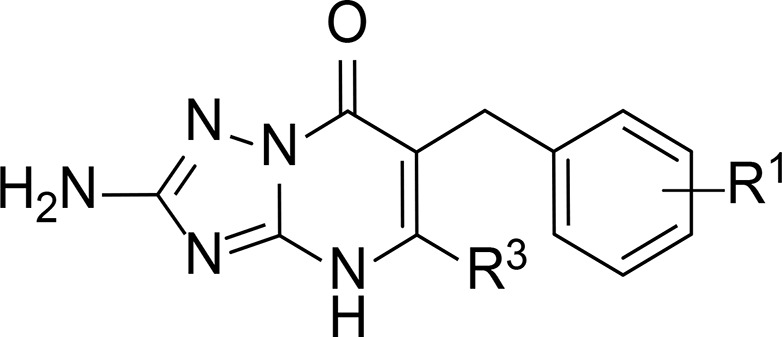
Table 3. Characterization of Compounds 37–43 in hCCR2 and hCCR5a.

| hCCR2 | hCCR5 | |||
|---|---|---|---|---|
| compd | R1 | R3 | pKi ± SEM (Ki, nM)b | pIC50 ± SEM (IC50, nM) or inhibition at 1 μM (%)c |
| 37 | 3,4-diCl | cPr | 9.35 ± 0.05 (0.4) | 6.67 ± 0.03 (214) |
| 38 | 3,4-diCl | iPr | 9.22 ± 0.05 (0.6) | 6.91 ± 0.09 (132) |
| 39 | 2,3-diCl | iPr | 8.81 ± 0.07 (1.6) | 7.09 ± 0.07 (84) |
| 40 | 2,5-diCl | iPr | 7.65 ± 0.03 (22.5) | 20% |
| 41 | 3,5-diCl | iPr | 8.66 ± 0.05 (2.2) | 6.49 ± 0.06 (336) |
| 42 | 3,5-diBr | iPr | 8.68 ± 0.01 (2.1) | 64% |
| 43 | 3-Br, 4-Cl | iPr | 9.42 ± 0.02 (0.4) | 6.95 ± 0.04 (115) |
Data are presented as mean pKi/pIC50 ± standard error of the mean (SEM) and mean Ki/IC50 (nM) of at least three independent experiments performed in duplicate.
pKi values from the displacement of ∼6 nM [3H]-CCR2-RA-[R] from U2OS cells stably expressing CCR2, at 25 °C.
Percent inhibition of β-arrestin recruitment in U2OS cells stably expressing CCR5 by 1 μM compound, in the presence of CCL3 (pEC80 = 7.9). pIC50 values were determined for compounds displaying more than 70% inhibition. % Inhibition values are presented as mean values of at least two independent experiments, performed in duplicate.
