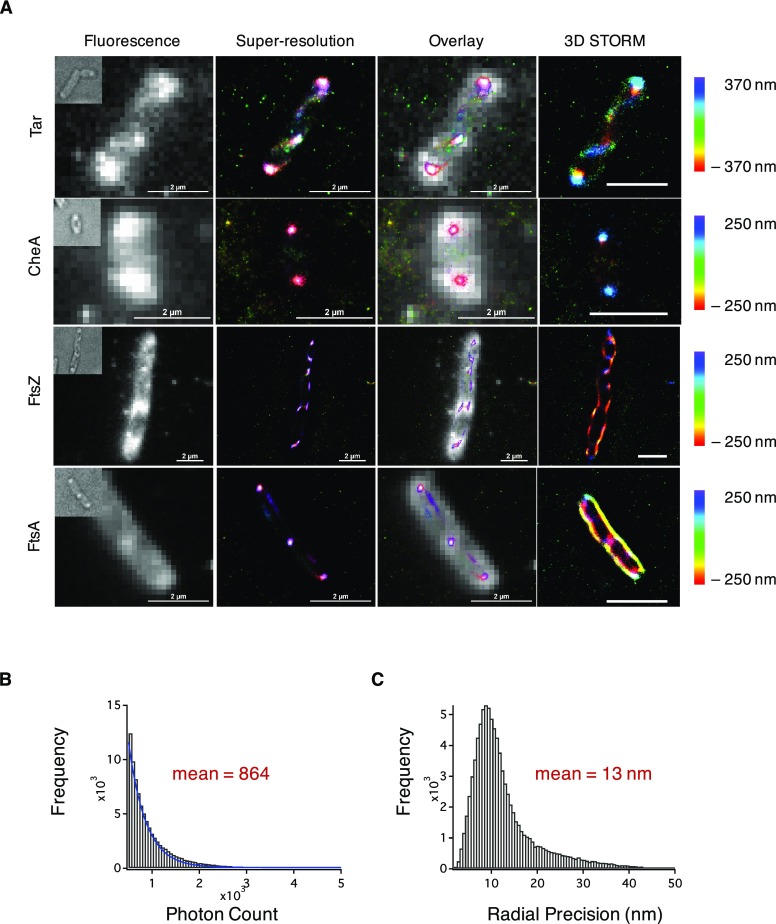
Figure 4.
Super-resolution imaging of bacterial proteins in live cells. Cells expressing one of four bacterial proteins were labeled with 1 and 2. (A) STORM images of bacterial proteins with polar localization (Tar and CheA) or septal localization (FtsZ and FtsA) expressed in E. coli. Bright-field images of cells are shown in the top left corner of the fluorescence images. Scale bar = 2 μm. (B) Histogram indicating the number of detected photons during image acquisition with the fit to a single exponential (blue curve). The mean number of photons is calculated from the single-exponential fit. (C) Mean radial precision for imaging in live bacterial cells.

