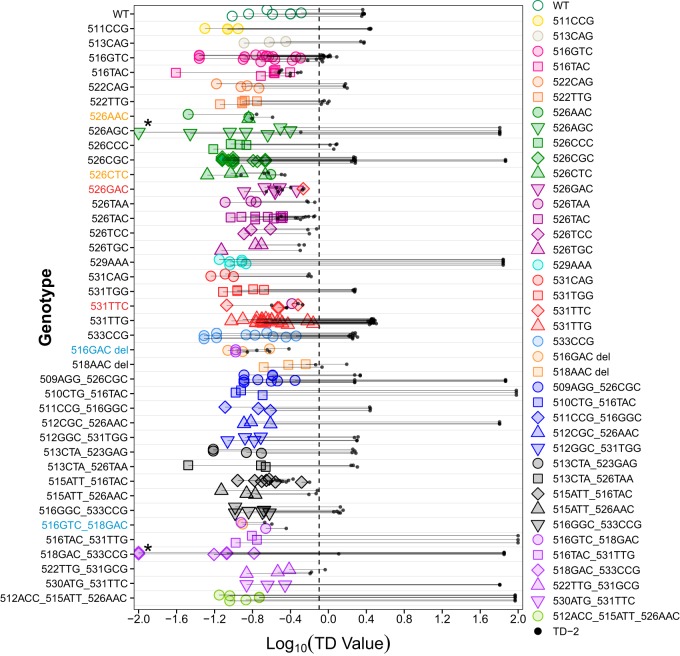
FIG 3.
TD-1 and TD-2 values determined for each sample in logarithmic transformation. Each genotype was tested on multiple samples or for multiple times on one sample to generate at least 3 replicates. Horizontal lines indicate the distance between TD-1 (colored data points) and TD-2 (black dots) of individual replicates. Colors and shapes of each data point represent the reference mutant corresponding to TD-1 values. The vertical dashed line indicates the cutoff for calling a mutant. *, 3 samples of 2 genotypes had TD-1 values of 0; therefore, 0.01 was added to their TD-1 values before logarithmic transformation was performed.

