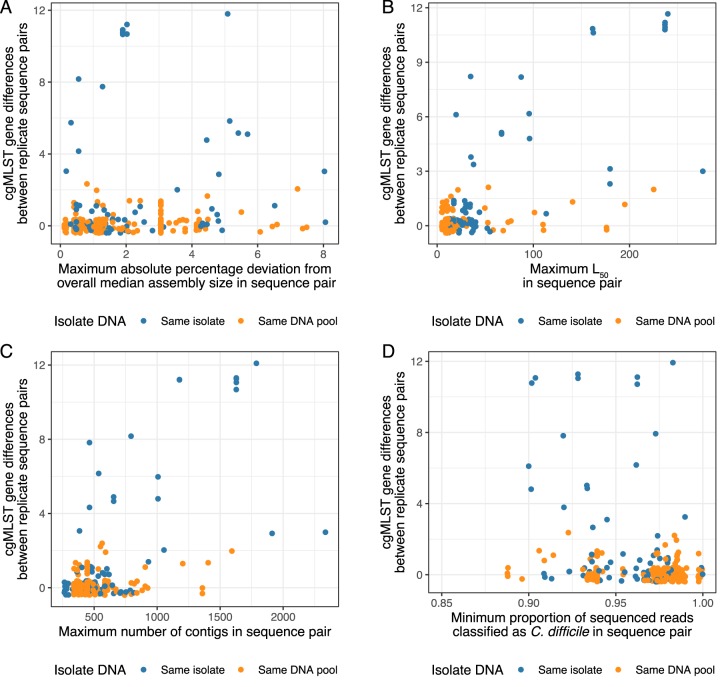
FIG 3.
Relationship between hash-cgMLST gene differences in replicate sequence pairs and de novo assembly quality metrics (A to C) and Kraken2 read classification (D). Jitter applied to points to assist visualization. One point is omitted from Fig. 3D for ease of visualization with the proportion of reads classified as C. difficile (0.64) and 0 gene differences. SPAdes with the “-careful” flag was used to generate assemblies.

