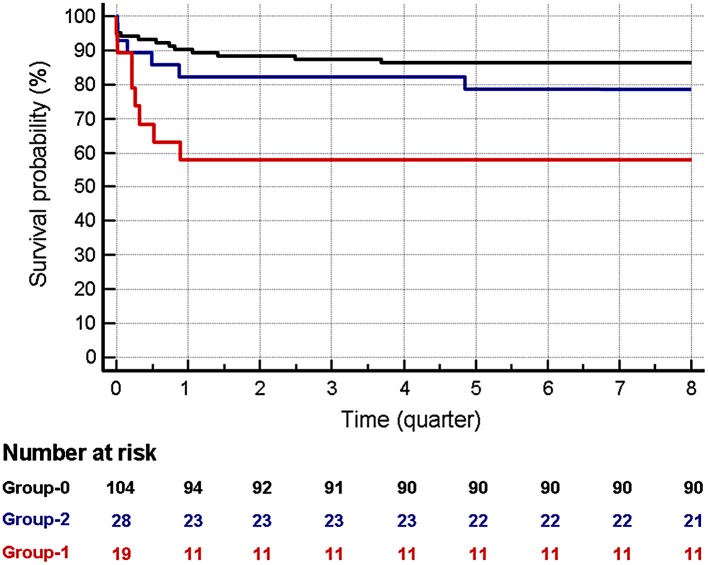
Figure 2.
Survival at 2 years in patients in the three groups. Red: Group-1. Blue: Group-2. Dark: Group-0. The time is indicated in quarters. Mortality in group-1 is higher than in group-0, both at 3 months (HR:5.08; 95% CI: 1.36–19.01) and at 2 years (HR: 3.82; 95% CI: 1.15–12.66). No significant differences were observed between patients in Group-2 vs. Group-0 both at 3 and 24 months.

