Table 1.
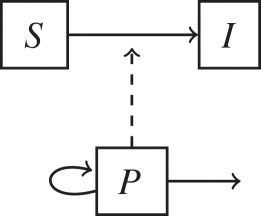
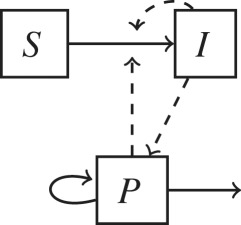
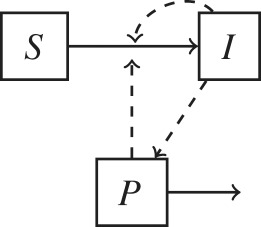
The inclusion of environmental processes in epidemiological models depends on the pathogen lifestyle (sapronotic versus parasitic) and relative contribution of different transmission pathways. Flow diagrams for epidemiological models based on these two criteria are presented. Hosts are categorized in two epidemiological states: susceptible (S) and infected (I). For simplicity, a recovered (R) is not represented. Pathogens in the environment are represented by the compartment P. Solid lines represent flows among variables and dashed arrows indicate when a compartment I or P contributes to new infections.
| pathogen classification | examples | model structure |
|---|---|---|
| (a) sapronotic only: | Legionella pneumonia |  |
| reproduce in the environment | Mycobacterium ulcerans | |
| environment-to-host transmission | Fusarium solani | |
| (b) sapronotic and parasitic: | Vibrio cholera |  |
| reproduces in the environment/host | Bacillus anthracis | |
| environment-to-host transmission | Geomyces destructans | |
| other transmission modes | ||
| (c) parasitic only: | chronic wasting disease (prions) |  |
| reproduces in the host | Cryptosporidium parvum | |
| environment-to-host transmission | Clostridioides difficile | |
| other transmission modes | Salmonella enterica | |
| hantavirus | ||
| influenza | ||
| (d) no environmental role: | Chlamydia trachomatis |  |
| reproduces in the host | human immunodeficiency virus | |
| other transmission modes | Treponema pallidum |
