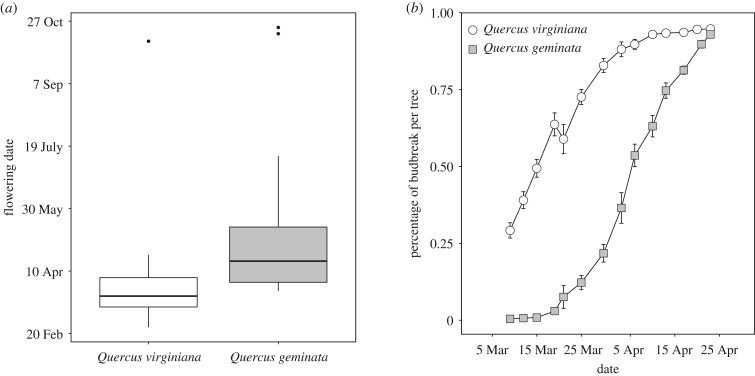
Figure 1.
Phenological differences between host plants Q. virginiana (Qv) and Q. geminata (Qg). (a) Boxplot of the average flowering date by host illustrating the median, 25th and 75th percentiles, and the 95% confidential intervals displayed. The dots outside of the boxes are outliers. (b) Cumulative frequency of budbreak of Qv and Qg (mean % budbreak per tree ± s.e.). Panels modified from Hood et al. [5].

