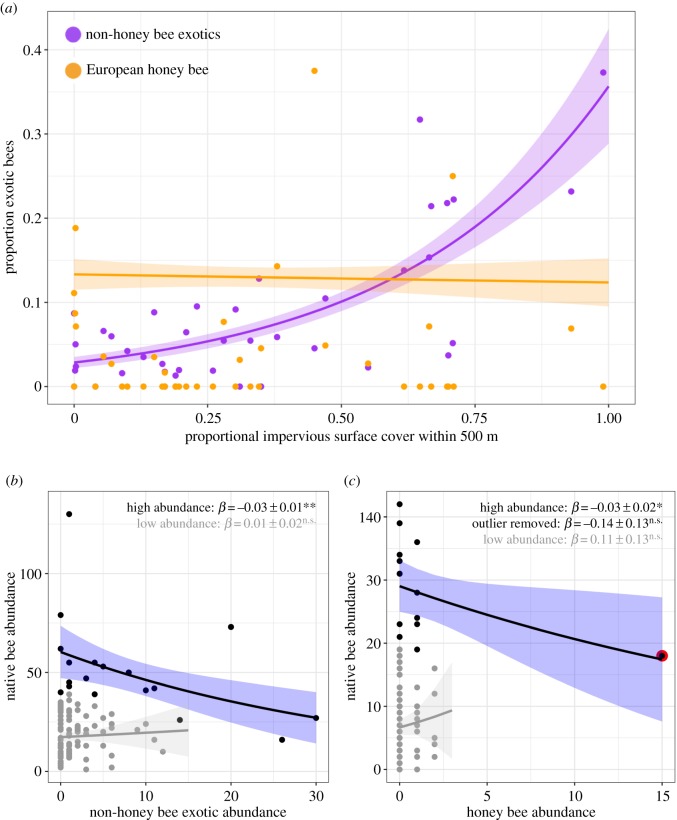
Figure 2.
(a) Relationship between urbanization and exotic bee proportional abundance. (b,c) Relationship between native and exotic bee abundance for (b) non-honeybee exotics and (c) honeybees. Grey points represent low-abundance sites; black points represent high-abundance sites (in (b), high abundance: ≥40 bees collected; in (c) ≥20 bees). Outlined point in (c) indicates outlier. Trendlines derived from GLMs. Significance codes: n.s.p > 0.05; *p < 0.05; **p < 0.01. (Online version in colour.)

