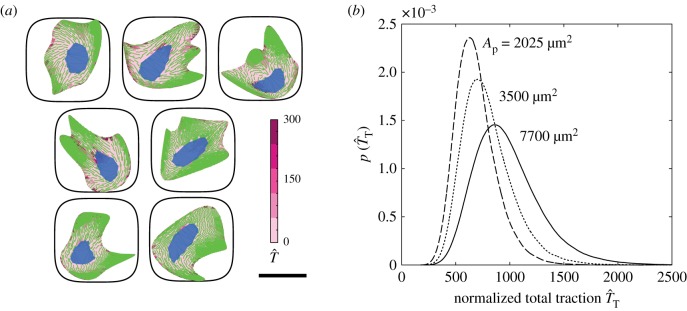
Figure 4.
(a) A selection of seven cell configurations selected from the homeostatic ensemble for hMSCs seeded on substrate patterned with adhesive islands of area . The predictions are shown as combined immunofluorescence-like images showing stress fibres (green), focal adhesions (pink) and nucleus (blue). Focal adhesions are parametrized by the magnitude of the normalized traction . Scale bar, 30 µm. (b) Prediction of the probability density function of normalized total traction for hMSCs seeded on adhesive islands of selected areas Ap. (Online version in colour.)

