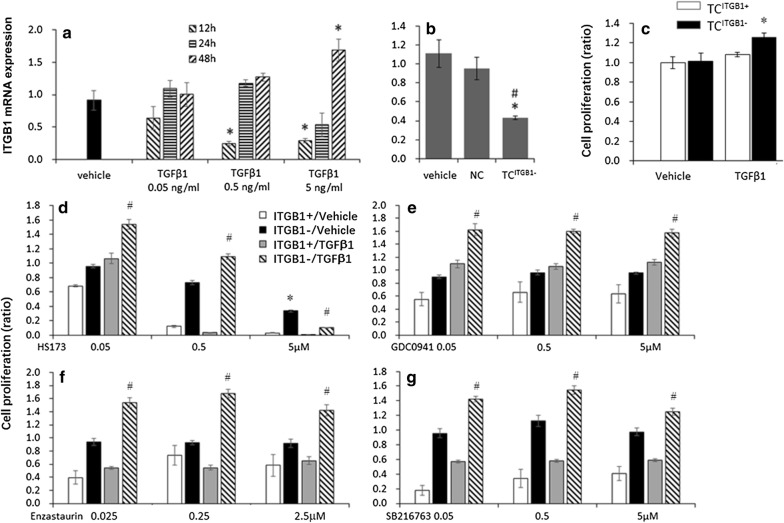
Fig. 3.
The effects of ITGB1 on cell proliferation of TCs treated with PI3K/p110α, PI3Kα/δ, PKCβ, or GSK3 inhibitors. a Expression of ITGB1 mRNA in TCs 12, 24, and 48 h after treatment with TGFβ1 at 0.05, 0.5, or 5 ng/ml, respectively. b Expression of ITGB1 mRNA in TCs treated with vehicle, non-specific sequencing (NC), or ITGB1 siRNA (TCITGB1−), * stand for p values less than 0.05, as compared with TCs; # stand for p values less than 0.05, respectively, as compared with NC. c Proliferation of TCs treated with vehicle (TCITGB1+) or ITGB1 siRNA (TCITGB1−), *stand for p values less than 0.05, as compared with TCITGB1+ treated with TGFβ1. d Proliferation of TGFβ1 or vehicle-treated TCITGB1+ or TCITGB1− 24 h after treatment with HS173 (PI3Kp110α inhibitor) at 0.05, 0.5 or 5 μM. e Proliferation of TGFβ1 or vehicle-treated TCITGB1+ or TCITGB1− after treatment with GDC0941 (PI3Kα/δ inhibitor) at 0.05, 0.5 or 5 μM. f Proliferation of TGFβ1 or vehicle-treated TCITGB1+ or TCITGB1− after treatment with Enzastaurin (PKCβ inhibitor) at 0.025, 0.25 or 2.5 μM. g Proliferation of TGFβ1 or vehicle-treated TCITGB1+ or TCITGB1− after treatment with SB216763 (GSK3 inhibitor). n = 3–6, *stand for p values less than 0.05, respectively, as compared with TCITGB1+; # stand for p values less than 0.05, respectively, as compared with TCITGB1+ treated with TGFβ1

