Fig. 4.
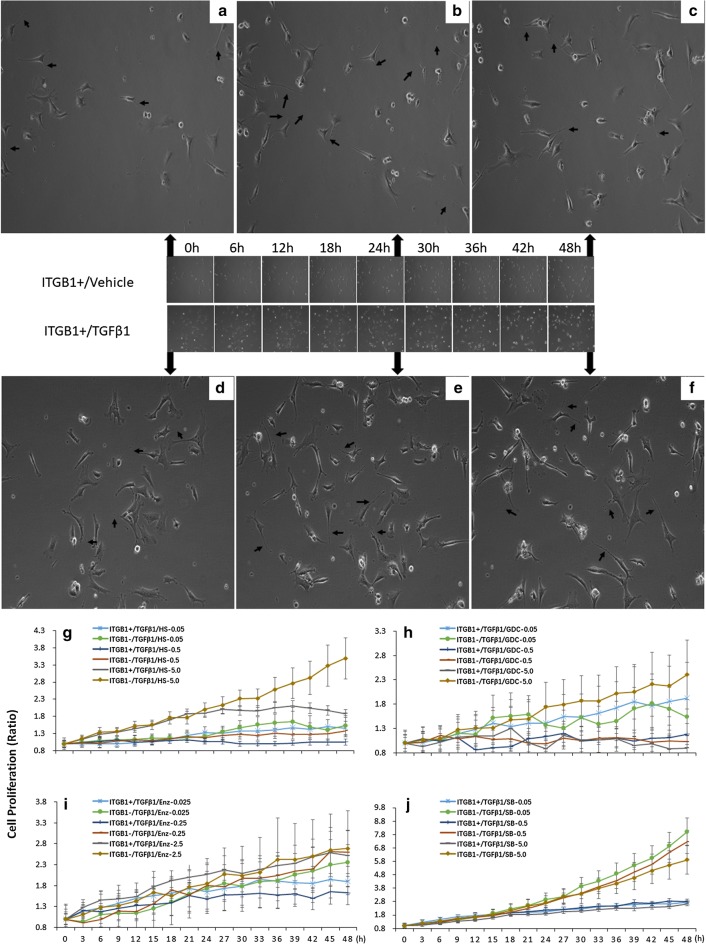
The effects of ITGB1on the proliferation curve of TC ITGB1+ treated with PI3K inhibitors and TGFβ1. a–c Representative photos of TCs cultured for 0 h, 24 h and 48 h captured by celliq, respectively. d–f representative photos of TCs treated within TGFβ1 for 0 h, 24 h and 48 h, respectively. Arrows show typical TCs with long and thin telopodes with dilations. Original magnification ×100. g Analysis of TC ITGB1+ or TCITGB1− proliferation with the treatment of HS173 and TGFβ1. h Analysis of TC ITGB1+ or TCITGB1− proliferation with the treatment of GDC0941 and TGFβ1. i Analysis of TC ITGB1+ or TCITGB1− proliferation with the treatment of Enzastaurin and TGFβ1. j Analysis of TC ITGB1+ or TCITGB1− proliferation with the treatment of SB216763 and TGFβ1, n = 6–8, **stand for p values less than 0.05, as compared with TC ITGB1+ treated with TGFβ1

