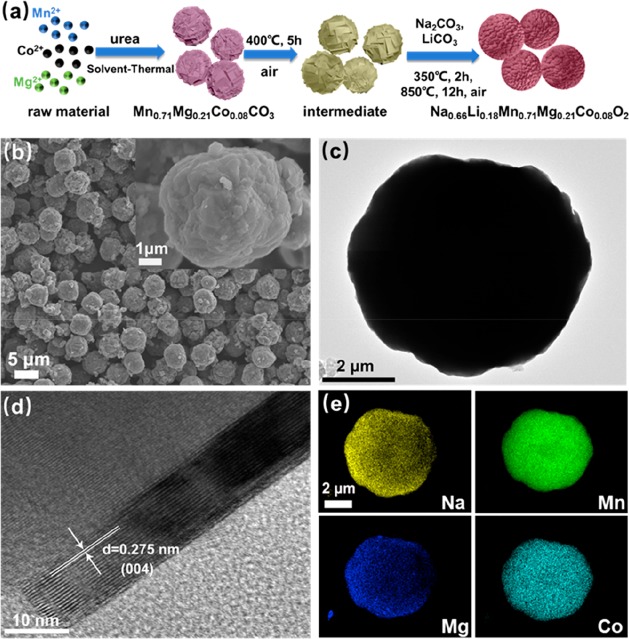
Figure 1.
(a) Schematic diagram of the preparation processes of s-NaLiMMCO. (b) SEM images of the as-prepared s-NaLiMMCO. (c) Typical TEM image of s-NaLiMMCO. (d) HR-TEM image of s-NaLiMMCO. (e) EDS mapping images of sodium, manganese, magnesium, and cobalt. The inset is the corresponding SEM image with high magnification.

