Figure 1.
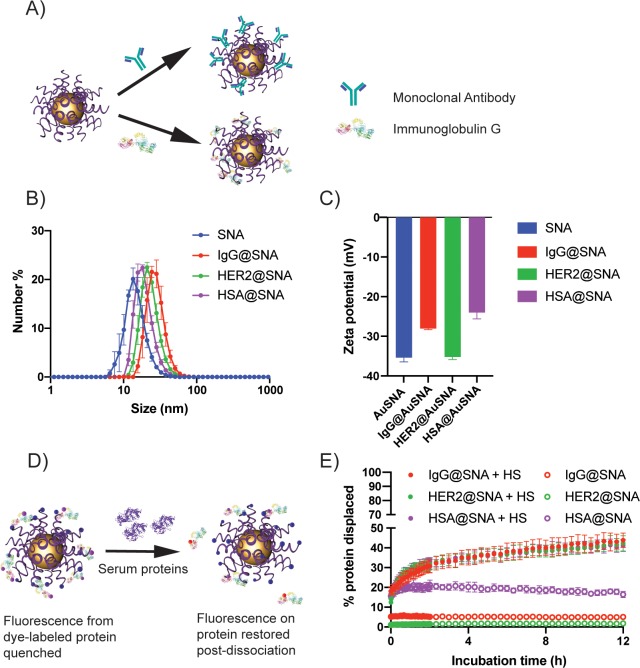
Synthesis and characterization of protein-adsorbed SNAs. (A) Schematic representation of monoclonal antibody (top) or IgG (bottom) immobilization on the ODN shell of SNAs. (B) Distributions of the hydrodynamic diameters of bare, IgG- (IgG@SNA), anti-HER2- (HER2@SNA), and HSA-immobilized SNAs (HSA@SNA). (C) ζ potentials of bare SNAs, IgG@SNAs, HER2@SNAs, and HSA@SNAs. (D) Schematic depicting the displacement of Texas Red-X-labeled proteins from the surface of Cy5-labeled SNAs by serum proteins. The fluorescence of Texas Red-X increases as protein displacement occurs. (E) Kinetic fluorescence profiles of Texas Red-X-labeled IgG, anti-HER2, and HSA during incubation with 10% serum proteins.

