Figure 3.
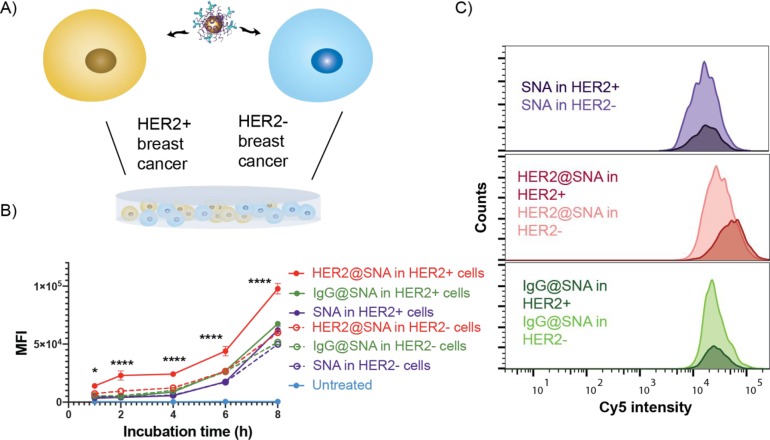
Selective cellular uptake of the monoclonal HER2 antibody-adsorbed SNAs. (A) Schematic describing the SNA treatment of the cocultured HER2-expressing breast cancer cells, SK-BR-3, and non-HER2-expressing breast cancer cells, MDA-MB-231. (B) Uptake profiles of anti-HER2-adsorbed (HER2@SNA), IgG-adsorbed (IgG@SNA), and bare SNAs following incubation for 1–8 h with the cocultured cells (solid circles, HER2-positive cells; open circles, HER2-negative cells). MFI = median fluorescence intensity. (C) Representative overlaid cellular uptake histograms (as measured by Cy5 intensity) for cocultured breast cancer cells after treatment with HER2@SNAs, IgG@SNAs, and bare SNAs for 6 h. The distributions of Cy5 fluorescence of HER2+ cells are denoted by the darker-shaded histograms, while those for the HER2– cells are shown in a lighter shade.

