Fig. 1.
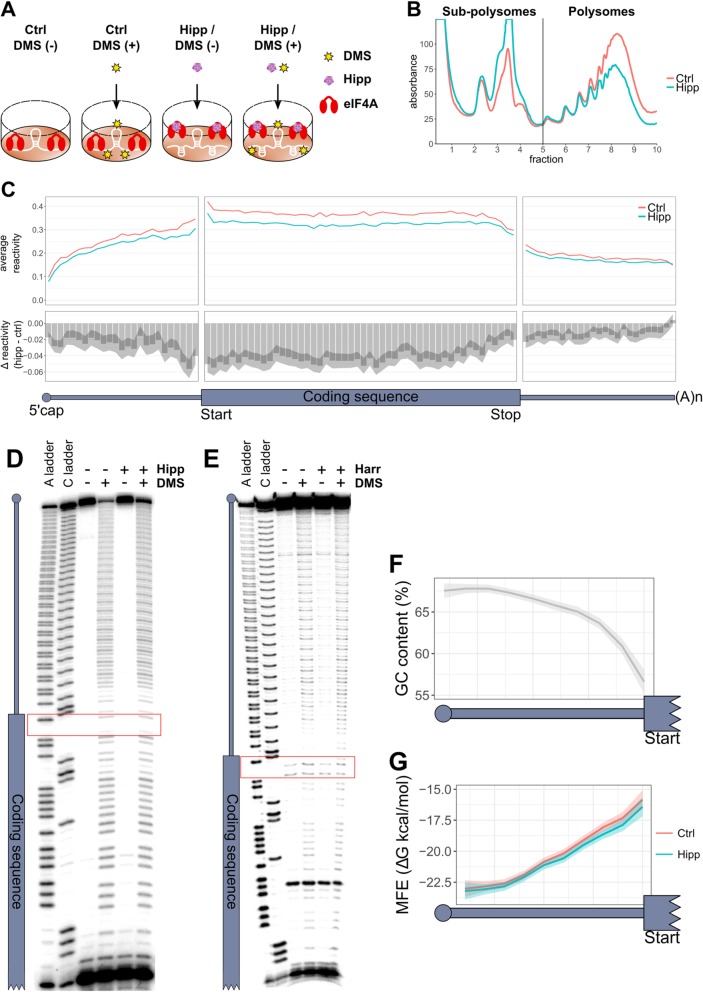
5′UTRs are innately more structured at their 5′ ends. a A diagrammatic representation of the experimental design. MCF7 cells were treated for 1 h with or without 150 nM hippuristanol (Hipp), followed by 10-min treatment with or without 50 mM DMS. b A representative polysome trace from three biological replicates for control (Ctrl) and hippuristanol (Hipp)-treated cells. See Additional file 1: Figure S1B-C for additional two replicates. c The top panel plots the binned average reactivity for control (Ctrl) and hippuristanol (Hipp) samples across the length of the UTRs (25 bins) and coding sequence (50 bins). The bottom panel plots the Δ reactivity, which is calculated by subtracting control from hippuristanol. Therefore, a negative value indicates decreased reactivity and therefore increased structure following hippuristanol treatment, whereas a positive value indicates less structure following hippuristanol treatment. Shaded area represents 95% confidence limits for the difference in means between control and hippuristanol mRNAs within each bin, calculated by a paired two-sided t test. All 1266 mRNAs included in the analysis have a 5′UTR, CDS, and 3′UTR at least 100 nt in length; have sufficient coverage and 5′ end coverage; and are the most abundant transcript per gene. d, e Sequencing gels showing the DMS reactivity of a reporter with an unstructured (CAA)24 5′UTR (see the “Methods” section) with and without either 1 μM hippuristanol (Hipp) or 20 μg/ml harringtonine (Harr) in nuclease untreated rabbit reticulocyte lysate. The gels show the cDNA following reverse transcription using a primer which binds within the coding sequence of the reporter (strong band at the bottom of the gel). Full length product is the band at the top of the gel, and the position of all aborted products is denoted by the diagram of the transcript to the left, with the red boxes highlighting the position of the start codon. A and C ladders were created exactly as the sample lanes, but with the addition of ddTTP and ddGTP respectively. f Mean binned GC content of all 50-nt windows, with a step of 10 nt, within the 5′UTR of all transcripts included in panel c. Shaded area represents 95% confidence intervals of the mean. g Mean binned minimum free energy (MFE) of all 50-nt windows, with a step of 10 nt, after folding with restraints derived from DMS reactivities under control or hippuristanol conditions, within the 5′UTRs of all transcripts included in panel c. Shaded area represents 95% confidence intervals of the mean

