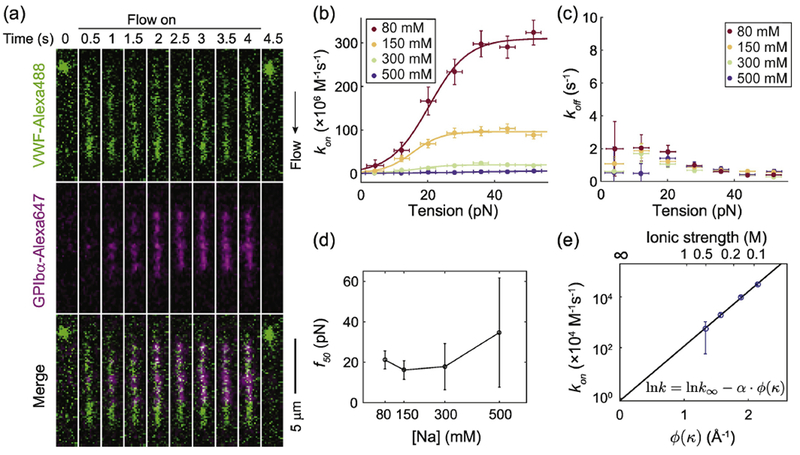
Figure 3.

VWF-GPIbα association kinetics are salt dependent. (A) Representative time-lapse dual color fluorescence images of VWF extension and binding to GPIbα at 80 mM NaCl after 1280 dyn cm−2 wall shear flow was turned on and off at 0 and 4 second, respectively. Association rates (B) and dissociation rates (C) between VWF and GPIbα under different [NaCl]. Lines in (b) are two-state model fit. (D) The 50% activation force vs [NaCl] (E) Association rate of the high affinity state vs the square root of ionic strength matches the electrostatic steering model. See equation (3) for details about the x axis. Error bars indicate 95% confidence intervals.
