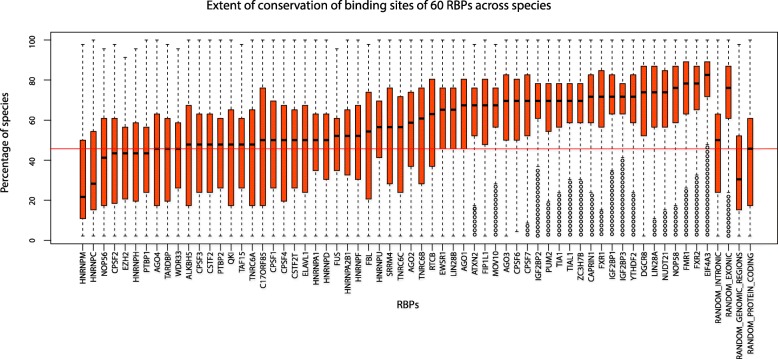
Fig. 2.
Boxplots showing the extent of conservation of binding sites for each of the 60 human RBPs. Each box plot corresponds to the distribution of the extent of conservation of experimentally identified binding sites of an RBP, across 46 species. Box plots have been arranged in the increasing order of median extent of conservation of binding sites. Circles in the boxplots correspond to the outliers

