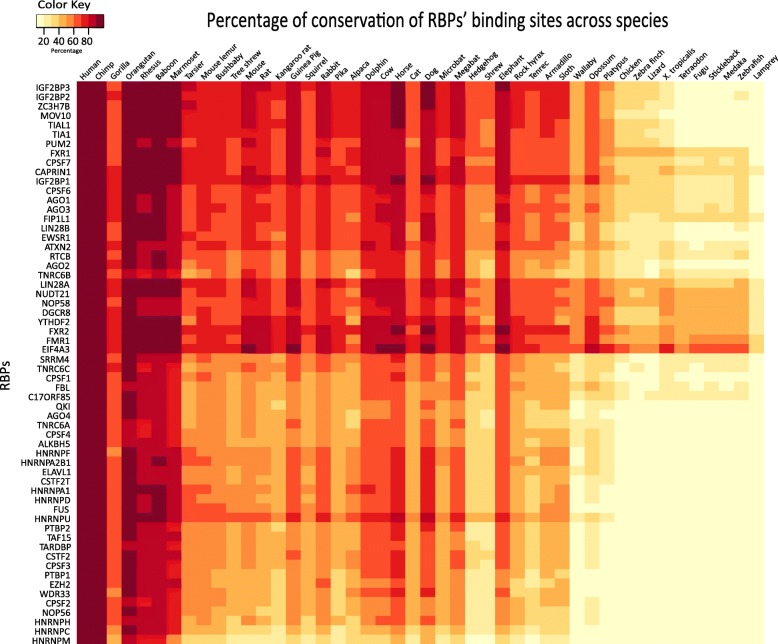
Fig. 3.
Heatmap showing the conservation of binding sites of RBPs across species. The columns in the heatmap represent species that are arranged based on their evolutionary distances using the R package ape [58], whereas the rows represent RBPs that have been clustered based on Euclidean distance and ward’s method using the function hclust in R. Each cell in the heatmap corresponds to the average extent of conservation of all the binding sites of an RBP in a specific species. While humans and chimps exhibit more than 80% conservation of binding sites of RBPs, lamprey exhibited the least with less than 40% conservation. RBPs NUDT21, EIF4A3 and LIN28A were found to show a high extent of conservation of binding sites across species, whereas the RBPs HNRNPC, HNRNPM and CPSF2 exhibited the least

