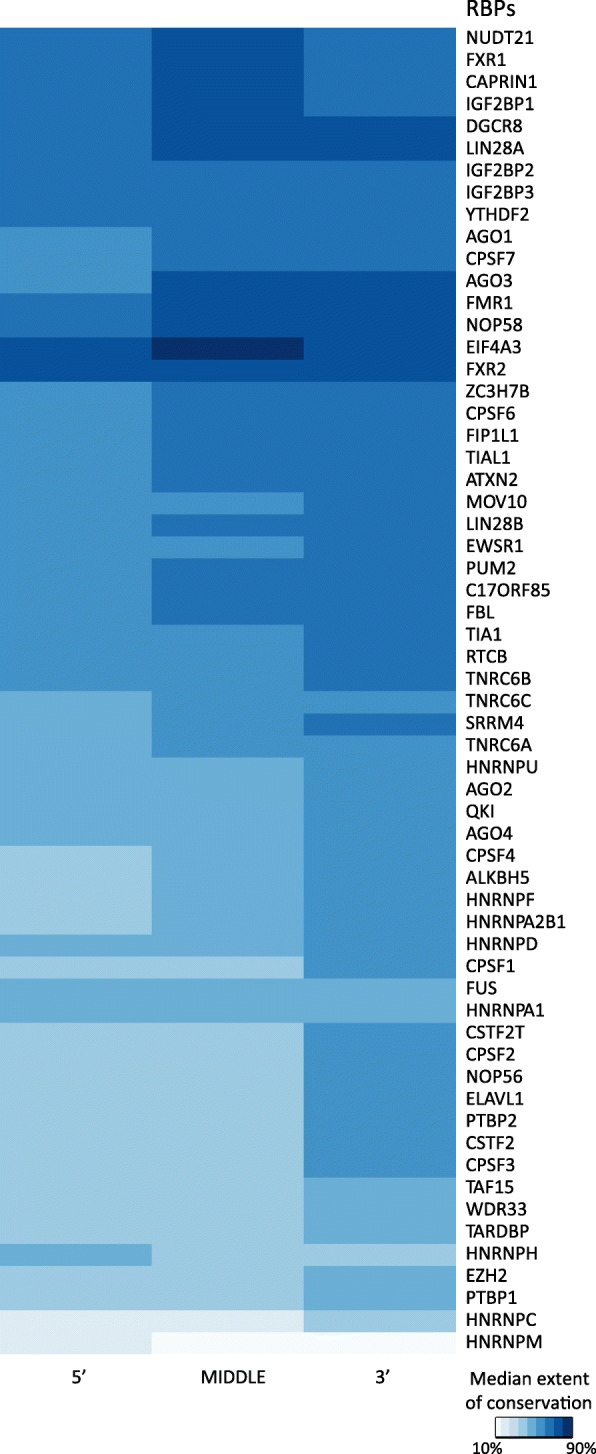
Fig. 5.

Heatmap showing the extent of conservation of binding sites classified based on their occurrence in the 5′, 3′ or middle region of a gene. Following the classification of all genes in the human genome into 3 equal segments namely 5′, 3′ and middle region, binding sites of RBPs were mapped onto these genic classes. Heatmap shows the median extent of conservation of binding sites of RBPs occurring in the genic classes indicated on the X-axis. Darker colors in the heatmap indicated by the scale bar correspond to higher median extent of conservation of the binding sites
