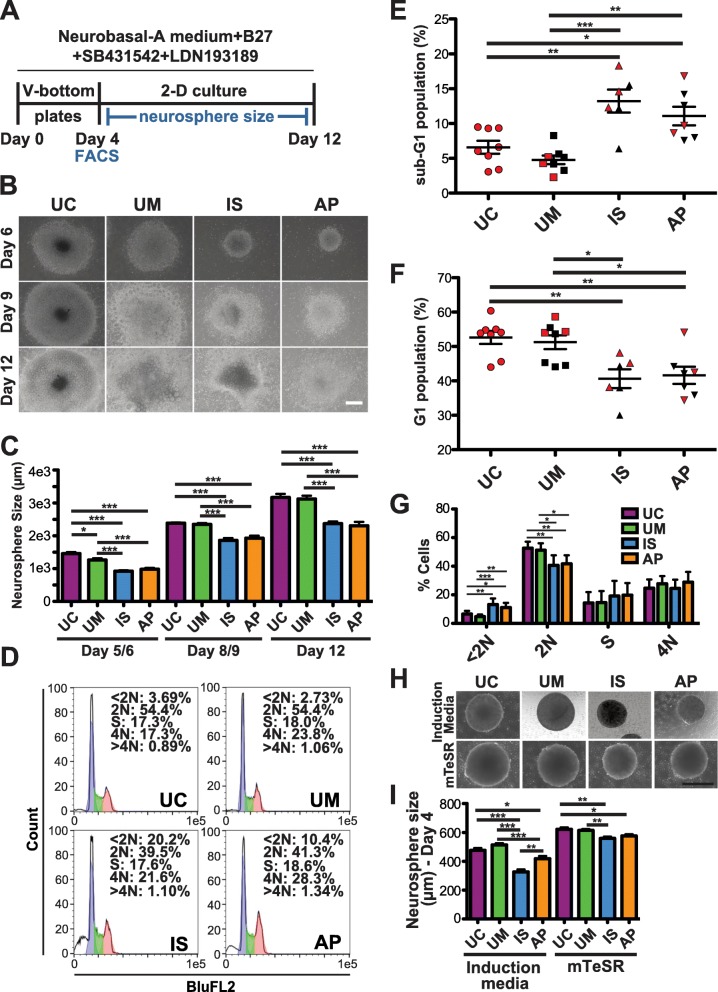
Fig. 2.
Characterization of iPSC lines during differentiation into cExN NPCs. a Differentiation scheme, including timeline and small molecules used. b, c iPSCs derived from an unrelated, unaffected control (UC), as well as the UM, IS, and AP were differentiated for 12 days to generate cExN NPCs. Neurosphere size at several time points is shown in (b) and quantified in (c) (mean ± SEM; scale bar = 500 μm; n = 16 biological replicates, encompassing two different clonal lines from each subject, and one clonal line for the UC). d-g At day four of differentiation, cells were stained with propidium iodide and FACS analysis of DNA content was performed. d Representative FACS plots. In (e) <2 N (sub-G1) and (f) 2 N (G1) cells are quantified, with values shown for each replicate. g shows mean values for all cell cycle stages for each cell line (mean ± SEM; n = 3 or more biological replicates for each subject, encompassing two different clonal lines from each subject, and one clonal line for the UC). h-i iPSCs were cultured in either neural induction media or in mTeSR stem cell media, and EB size was analyzed at day four of differentiation. Representative images are shown in (h) (scale bar = 500 μm), with quantification in (i) (mean ± SEM; n = 3 or more biological replicates for each subject, encompassing two different clonal lines from each subject, and one clonal line for the UC). P values *P < 0.05, **P < 0.01, ***P < 0.001 were determined by one-way ANOVA and all other pairwise comparisons had a non-significant P value (P ≥ 0.05). Red and black data points denote experiments performed with clone 1 or with clone 2, respectively

