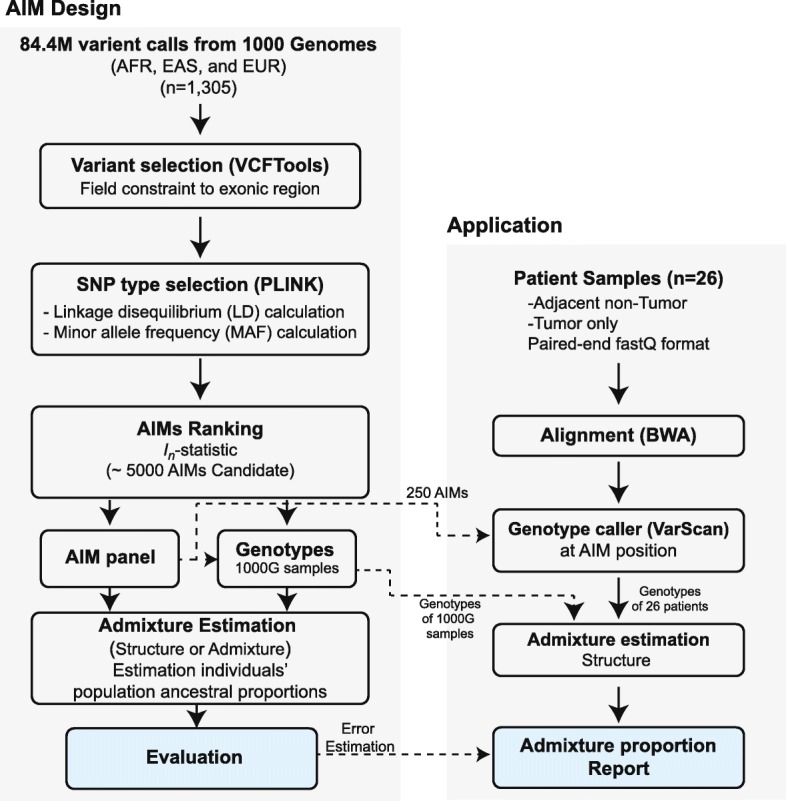
Fig. 1.

Flowchart of our AIM panel design and analysis pipeline. The pipeline is separated into two parts, AIM panel design (AIM Design) and Ancestral proportion estimation application (Application). For the AIM Design pipeline (left panel), variant files from the 1000 Genomes Project (n = 1305) were position filtered to exonic region by VCFTools. The variant files were calculated linkage disequilibrium (LD) and minor allele frequency (MAF) by PLINK. SNPs were selected as AIMs based on In-statistic for overall population or each continental population. Finally, population ancestral proportions were estimated by STRUCTURE. For the Application pipeline (right panel), the 26 HCC tumors with matched Adj. NT data were processed by standard WES analysis pipeline using BWA, GATK and genotype caller VarScan at AIM positions. The last step in this panel was admixture estimation and reported the ancestral proportions of individual
