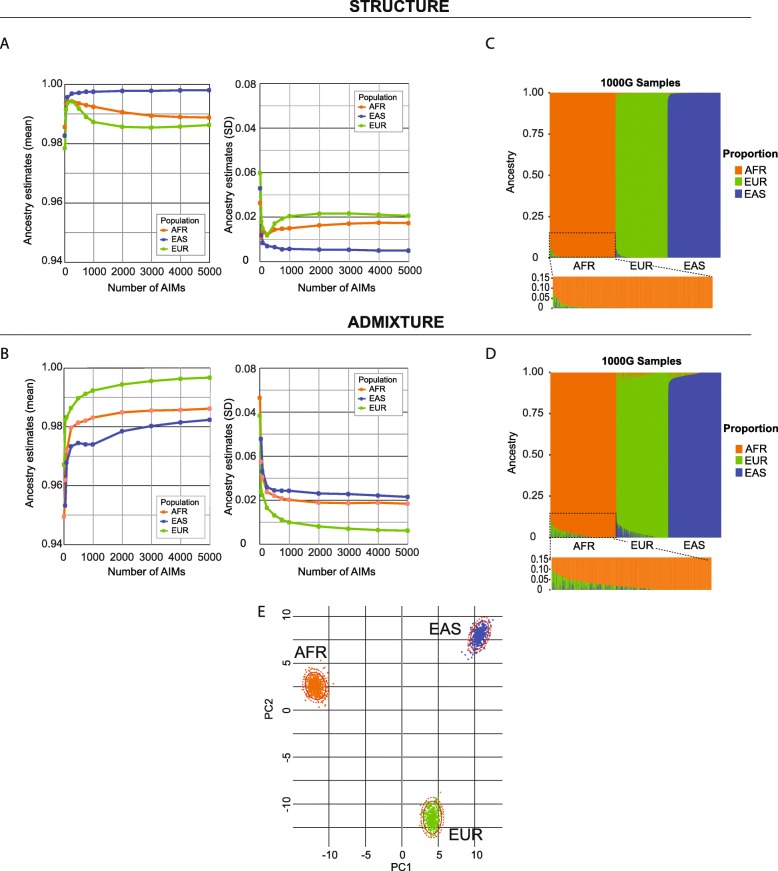
Fig. 2.
Selection of a tool for ancestral population proportion estimation. The results were presented as those from STRUCTURE (a, c) and from ADMIXTURE (b, d). (a, b) Performance of AIM panels with different number of markers. Mean and SD were plotted for each population. At 250 markers, the accuracy plateaus when STRUCTURE algorithm is used. (c, d) Proportion plot for ancestral populations on 250 AIMs using STRUCTURE and ADMIXTURE. The populations were ordered by groups: AFR: African, EUR: European, and EAS: East Asian. Individuals in (d) were ordered identically to (c). (e) PCA plots for three ancestral populations on 250 AIMs

