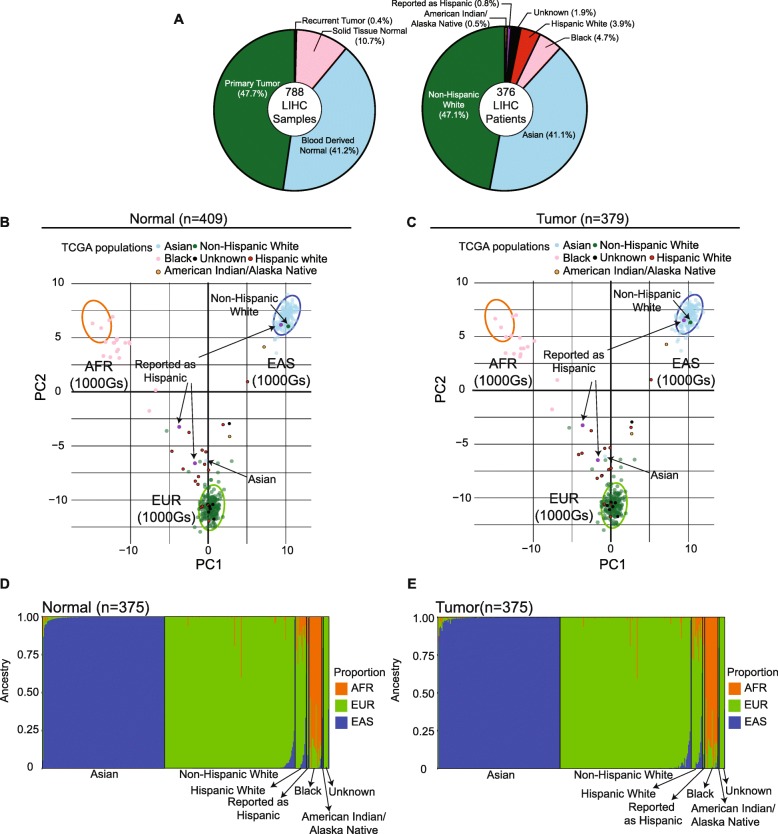
Fig. 5.
Application to 788 TCGA-LIHC samples (376 patients). (a) Summary of TCGA-LIHC samples and patients. Left and right pie charts are the break-down of sample types and self-reported race and ethnicity of all LIHC patients. (b, c) PCA plots of 788 TCGA-LIHC samples (normal: n = 409; tumor: n = 379). Normal group includes DNAs derived from blood and/or solid tissue normal, and tumor group includes primary tumor and recurrent tumor. Purple points were these from patients “Reported as Hispanic”. The confidence interval depicted by three ellipses (determined from 3 continental population EAS, EUR and AFR of the 1000 Genomes Project) is 0.99. (d, e) Proportion plots for 375 TCGA-LIHC patients with matched normal (blood derived normal: n = 325; solid tissue normal: n = 50) and primary tumor samples, ordered by sample ID

