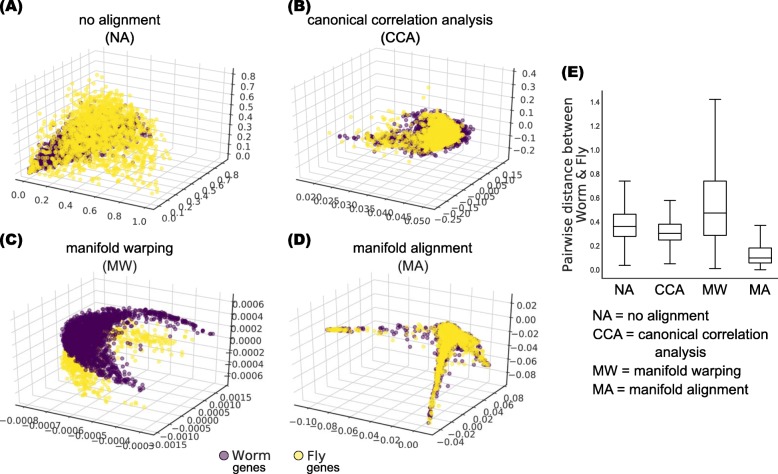
Fig. 2.
ManiNetCluster outperforms alternative methods to align cross-species developmental gene networks. a-d Scatter plots show worm and fly orthologous genes on common 3D manifolds: NA - Absence of data alignment, CCA - canonical correlation analysis, MW - manifold warping and MA - manifold alignment. e Boxplots show the orthologous gene distance (Chebyshev distance) on a-d. The box extends from the lower to upper quartile values of the data (pairwise distance between worm and fly), with a line at the median. The whiskers extend from the box to show the range of the data. Outliers beyond the whiskers are omitted from the plot

